DERMATITIS
Background
What is dermatitis?
Key Findings
Here are some key findings…
Relative Incidence by Industry and Occupation
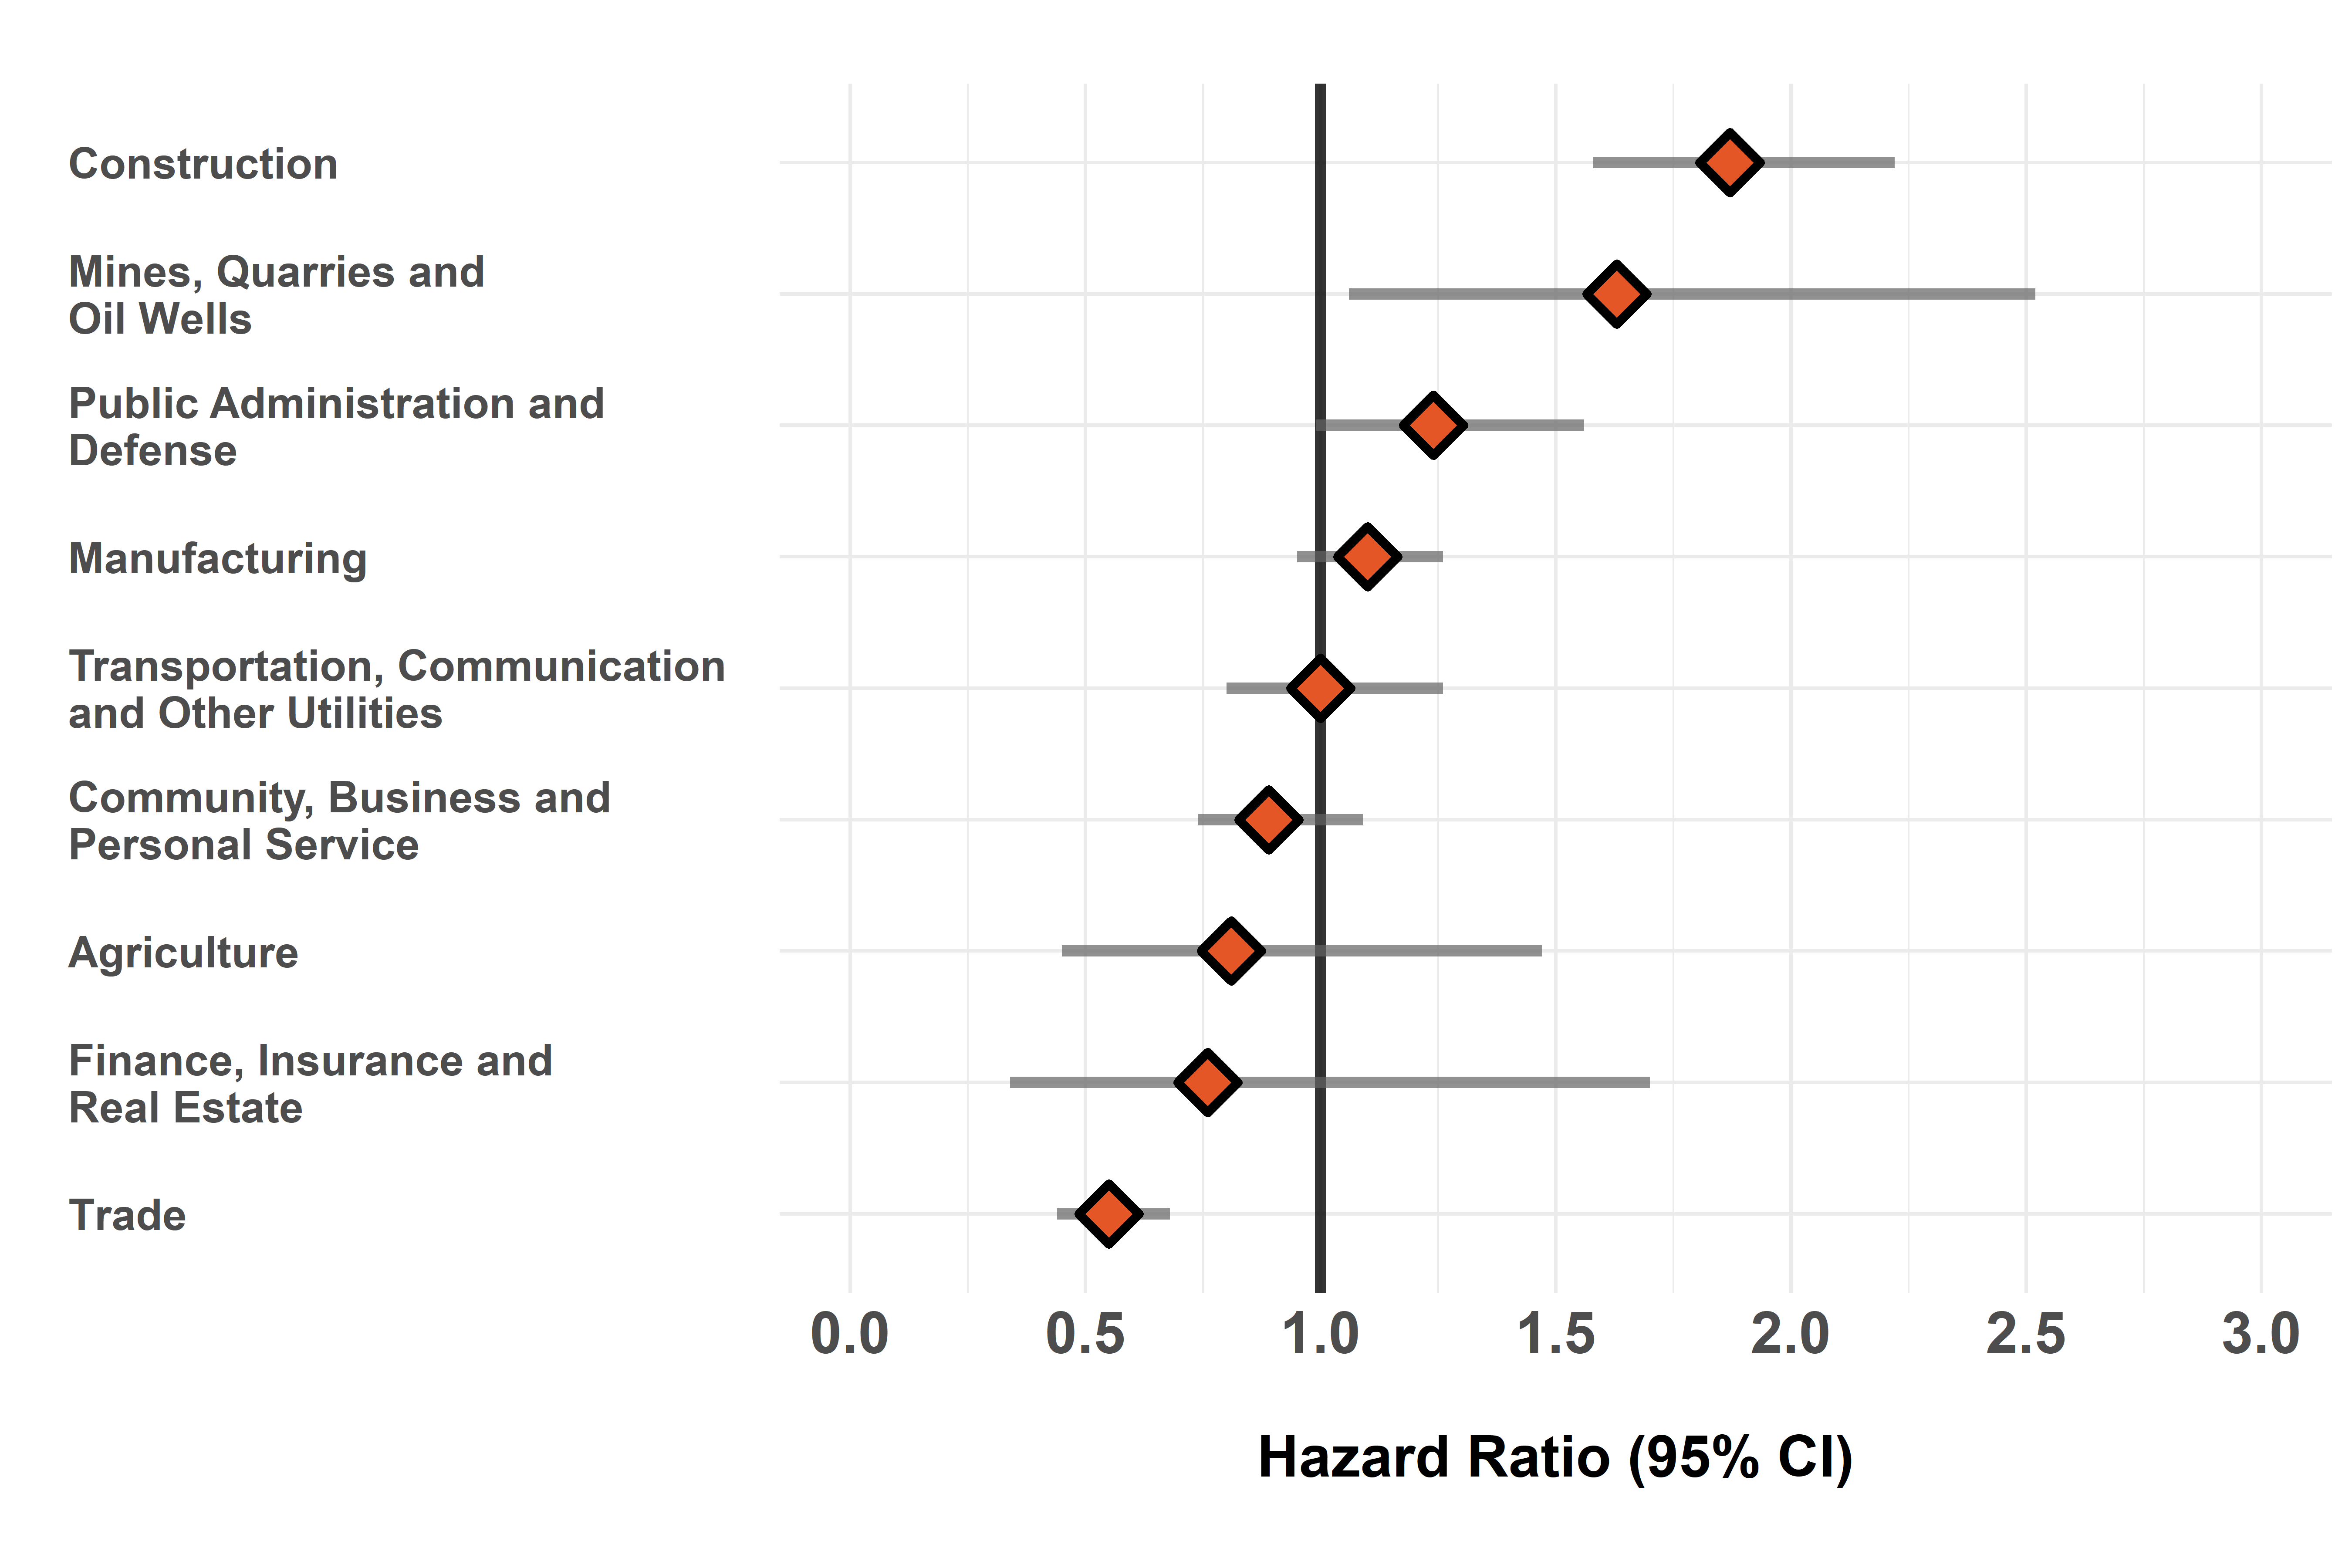
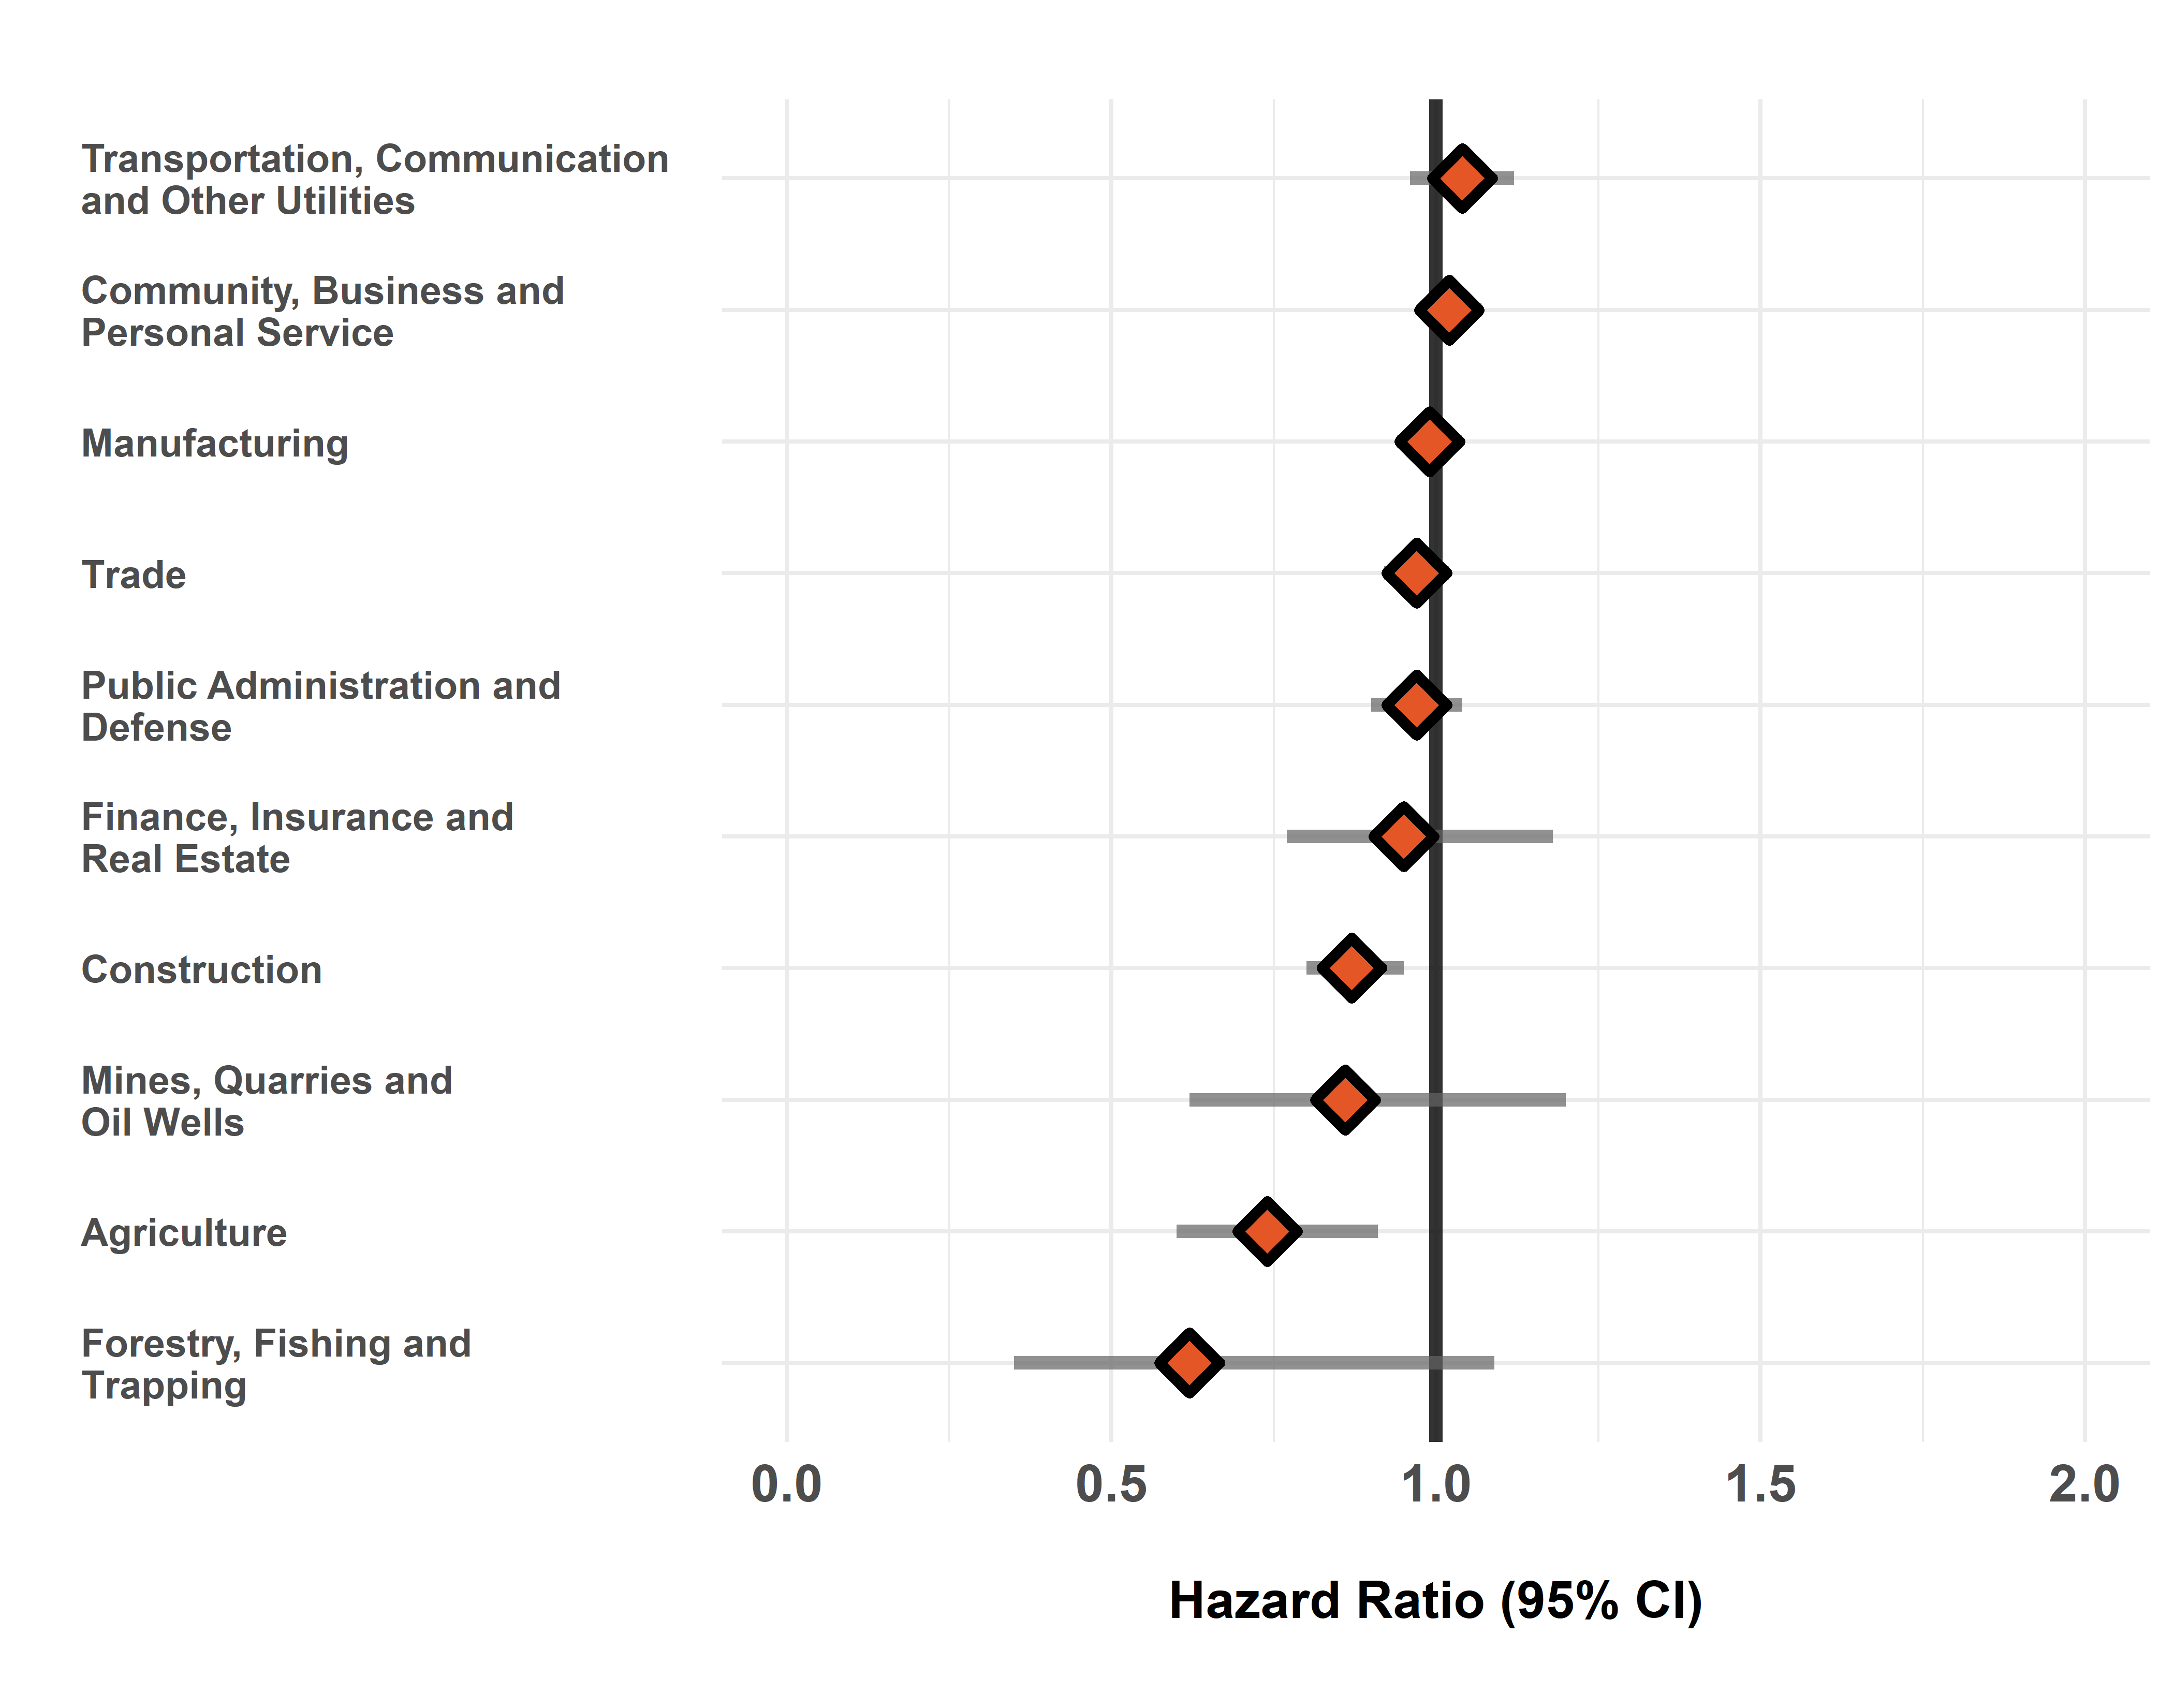
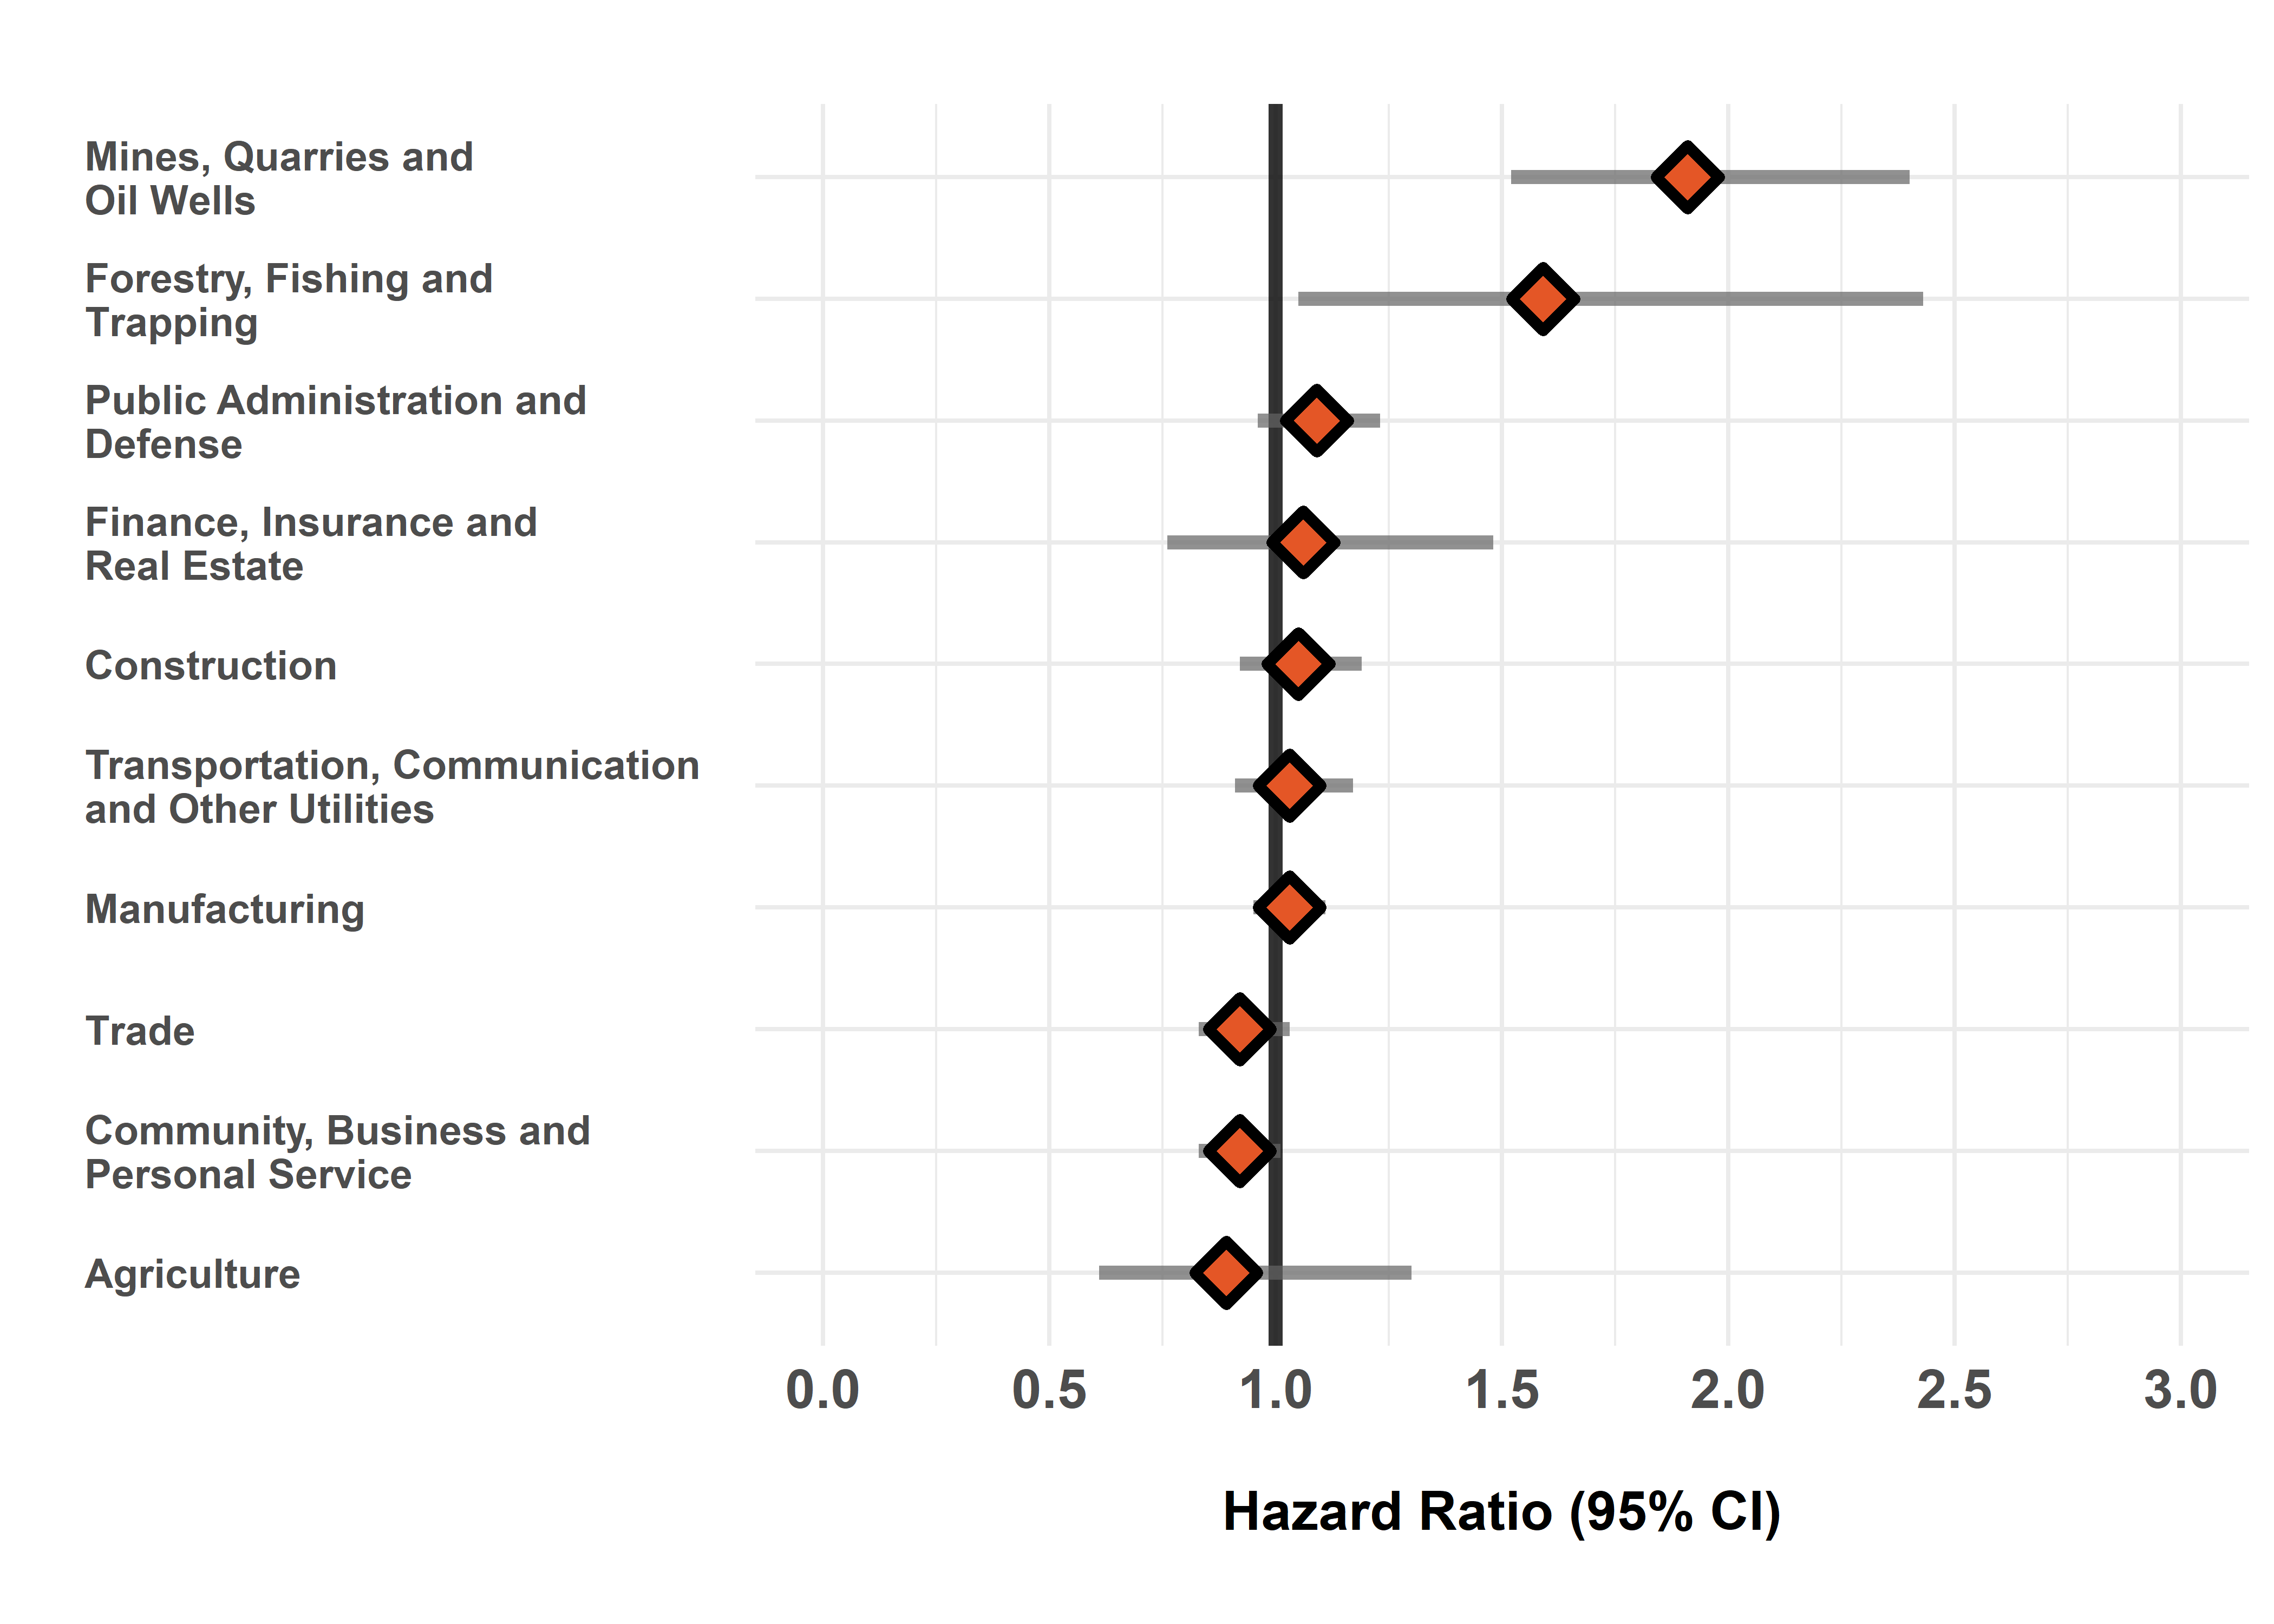
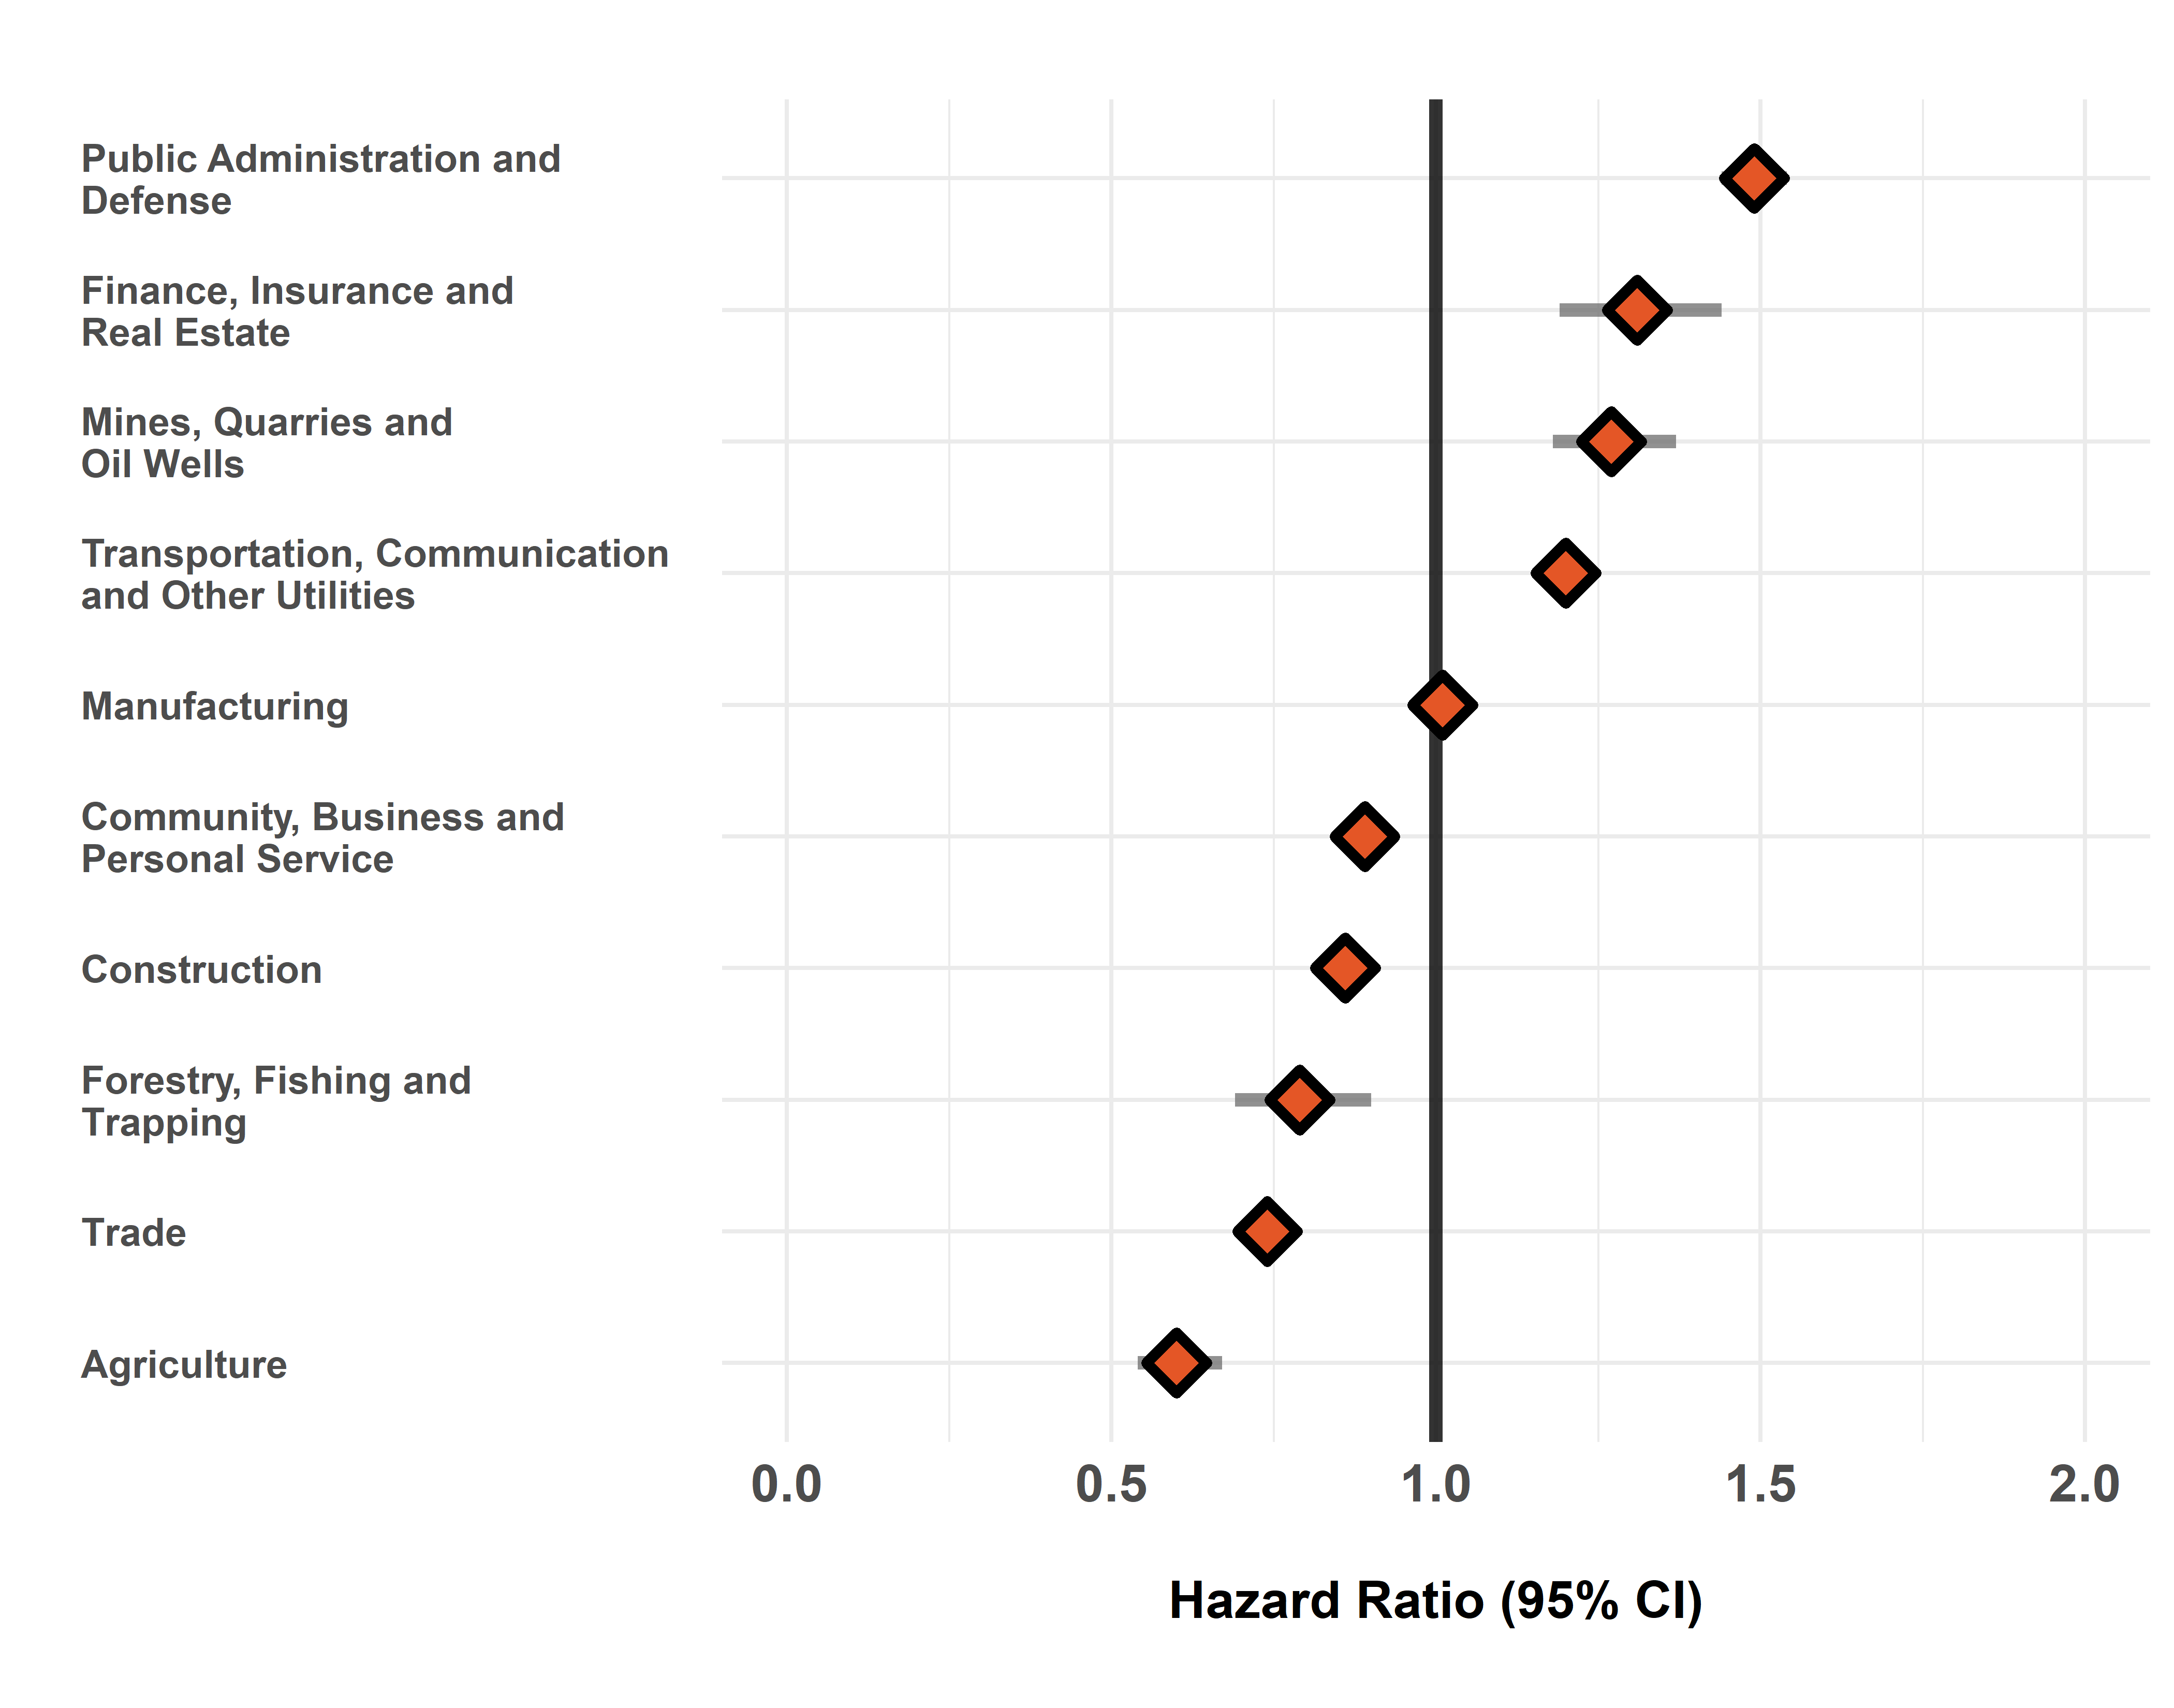
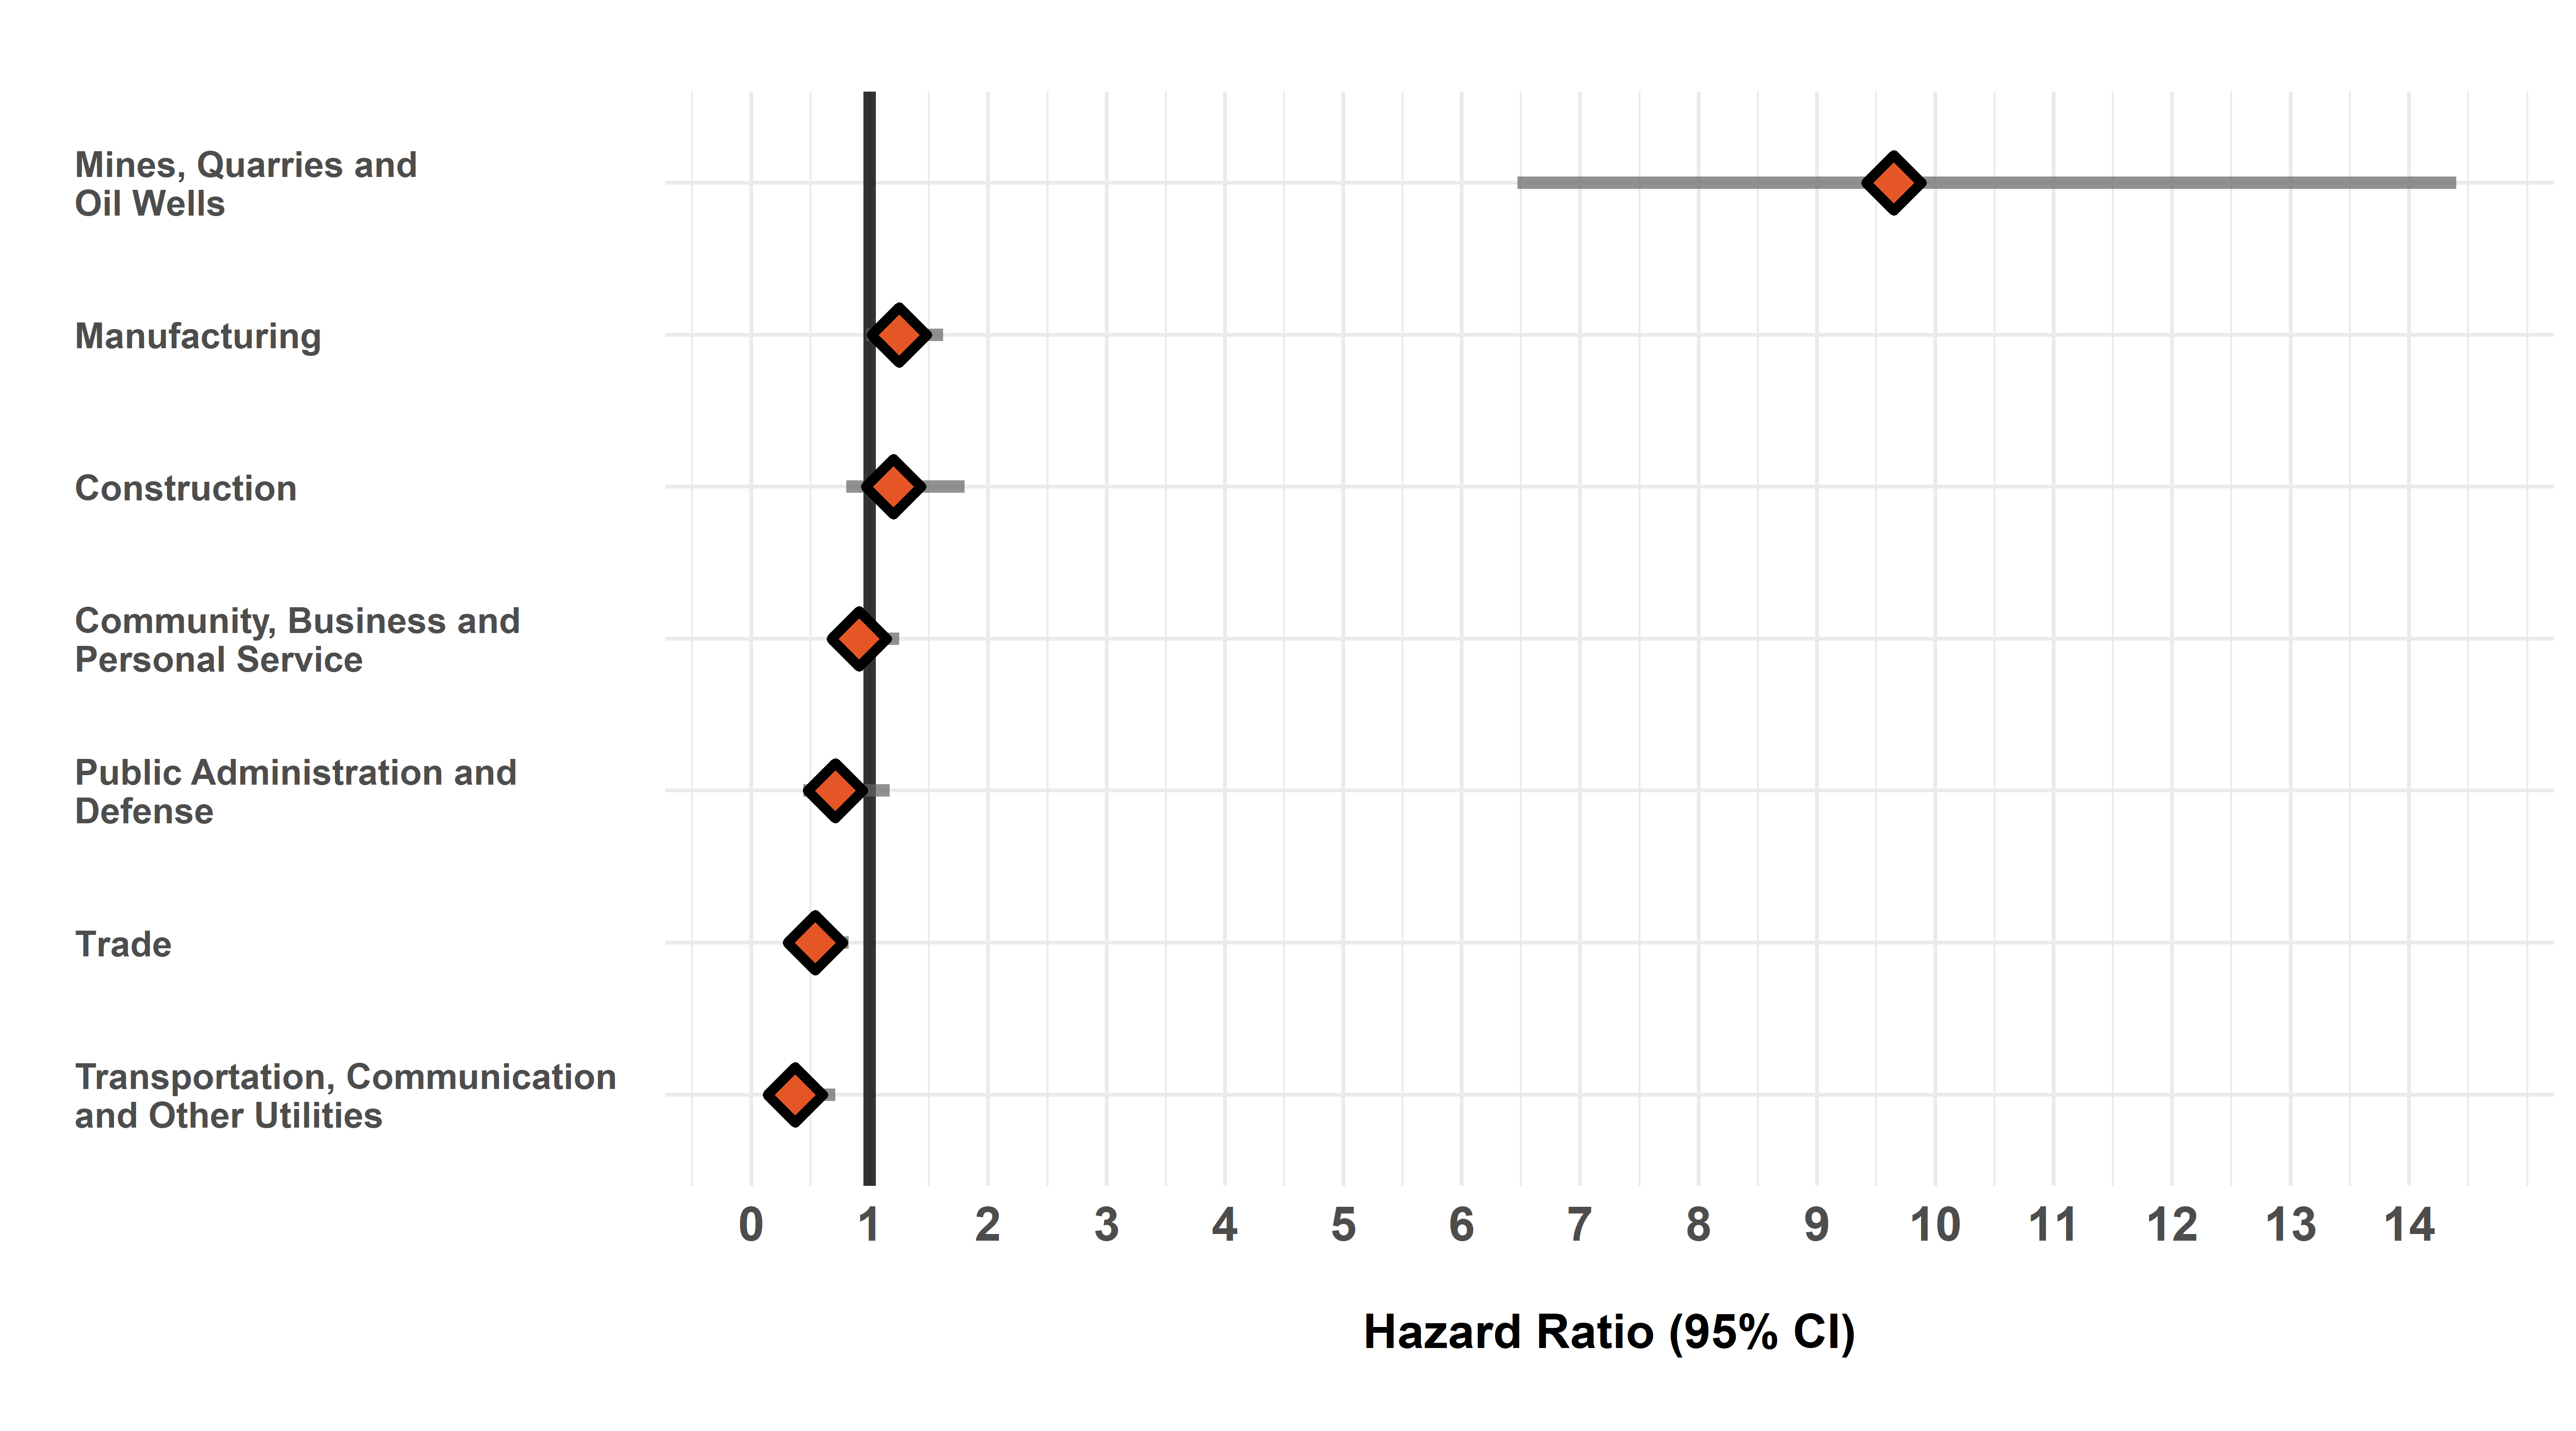
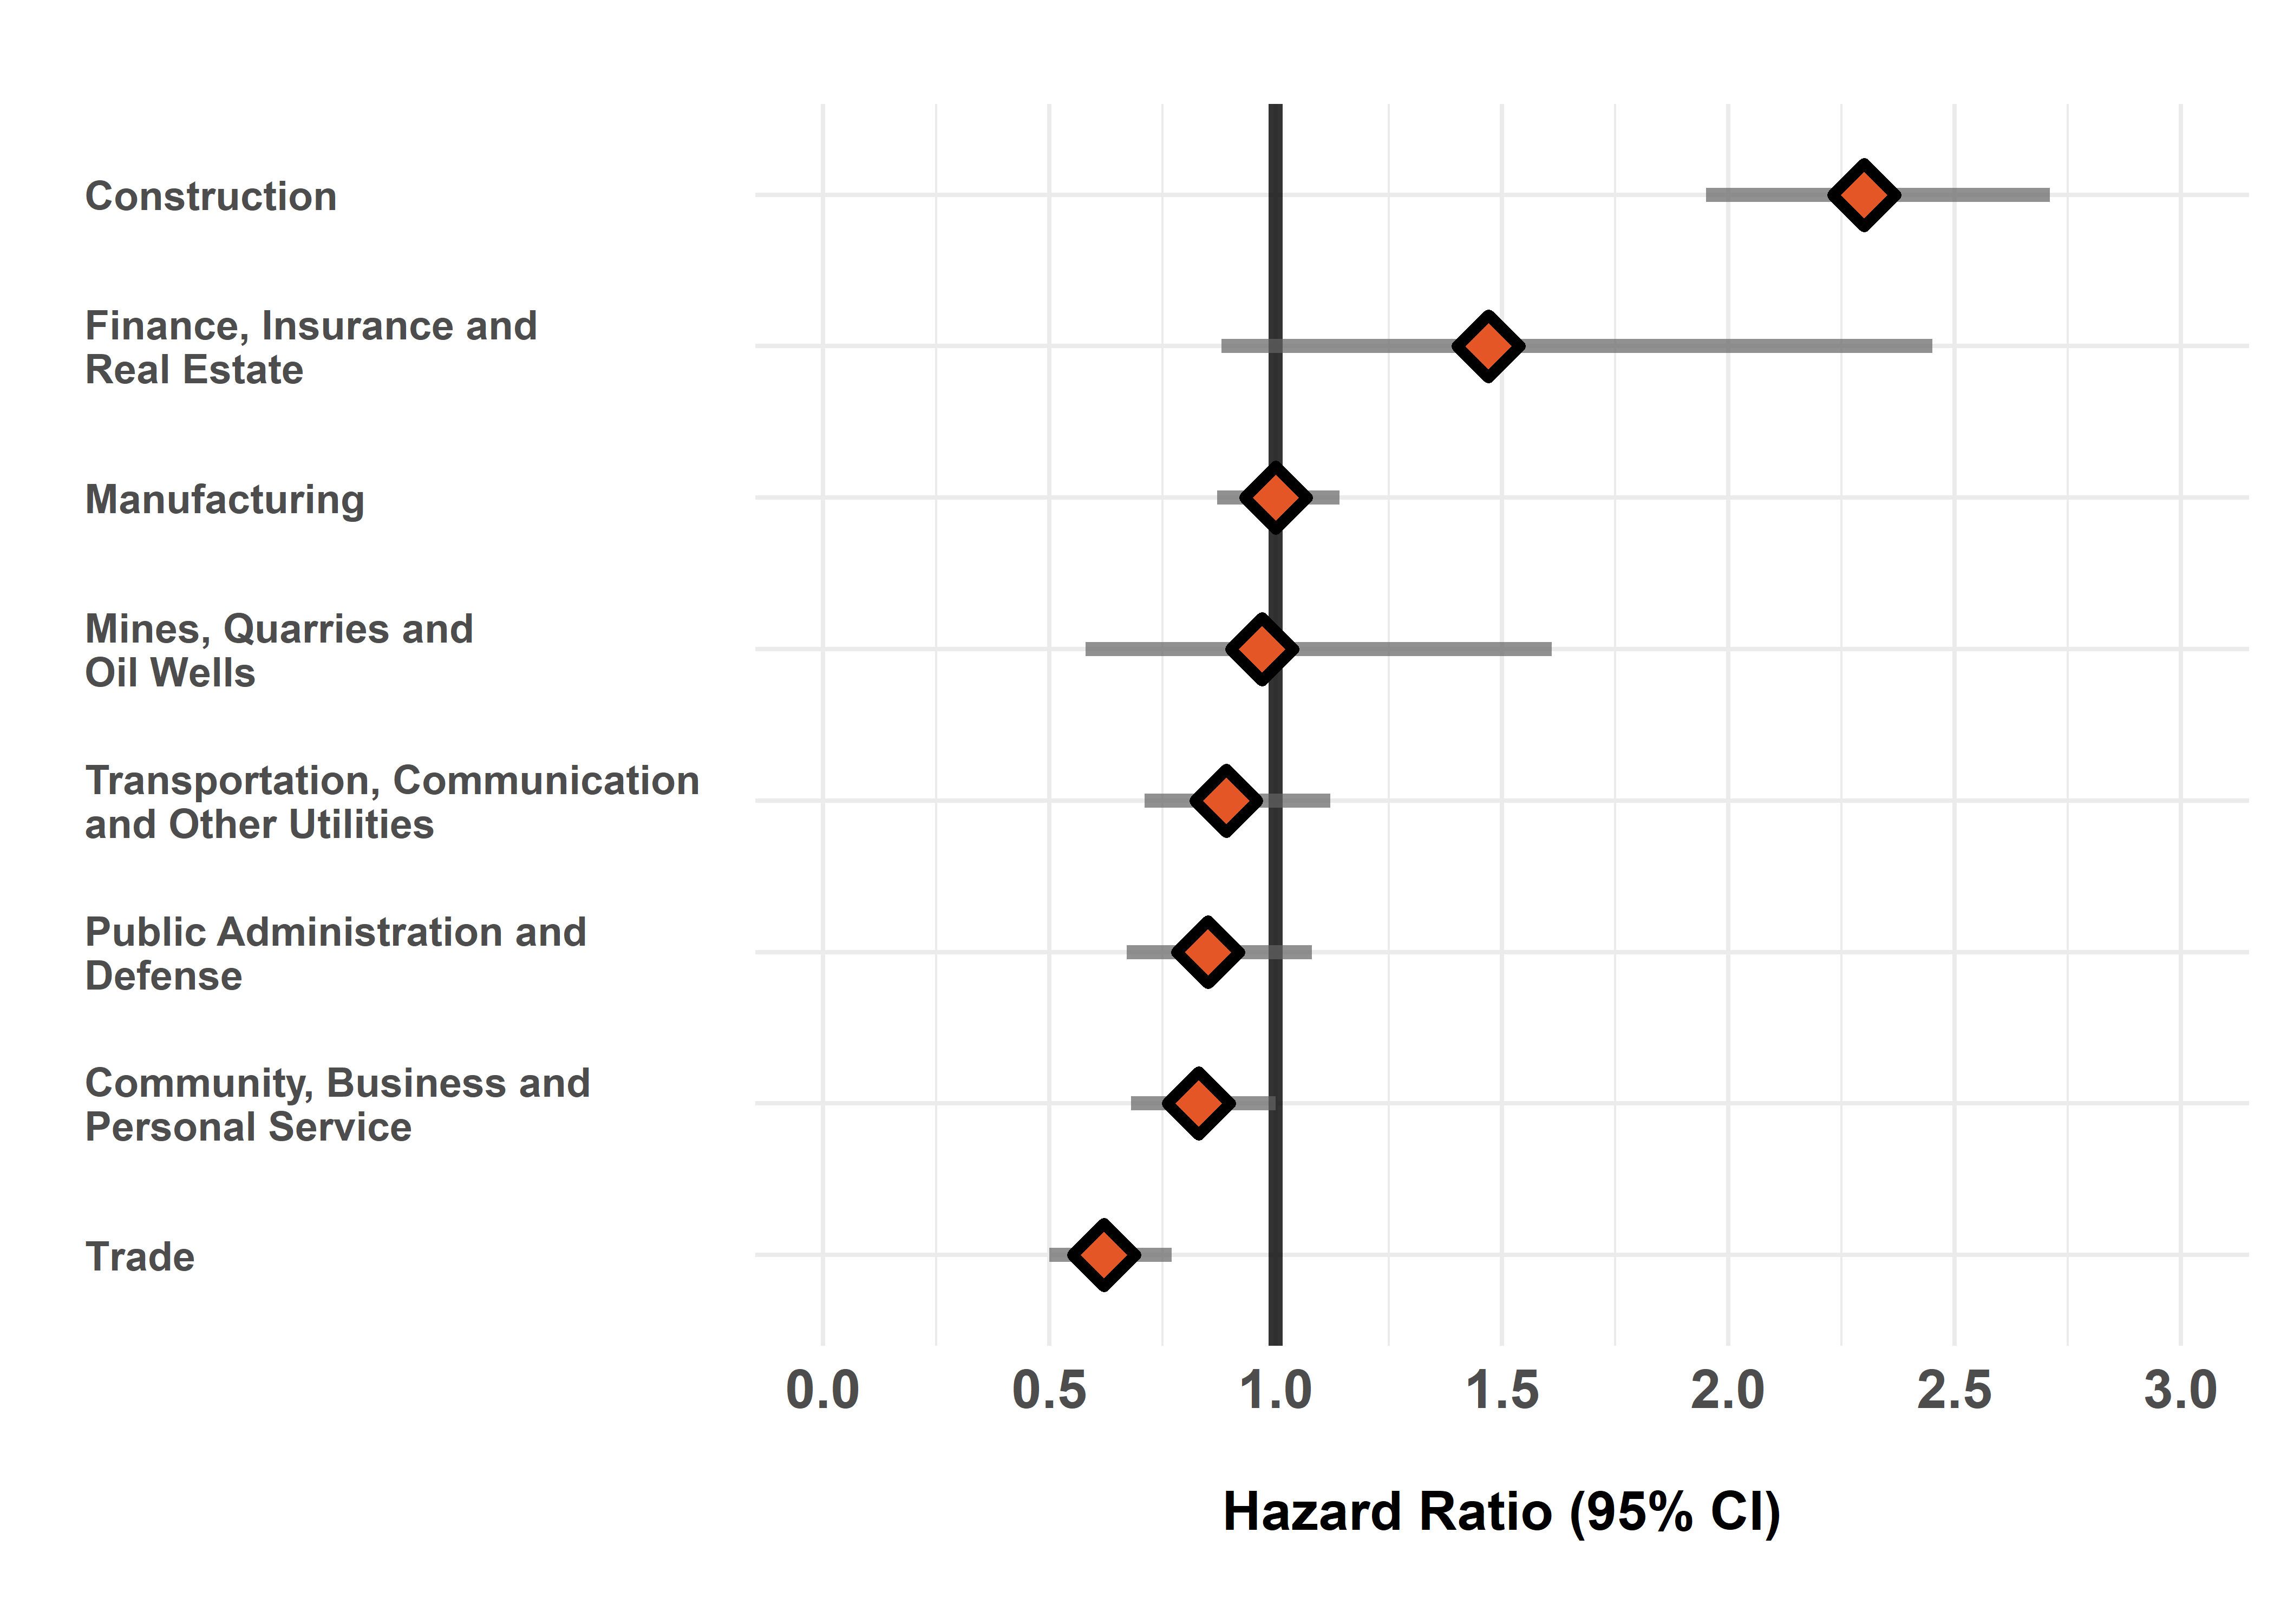
FIG1. Incidence of dermatitis diagnoses among workers employed in each industry group relative to all others, Occupational Disease Surveillance System (ODSS), 1999-2016
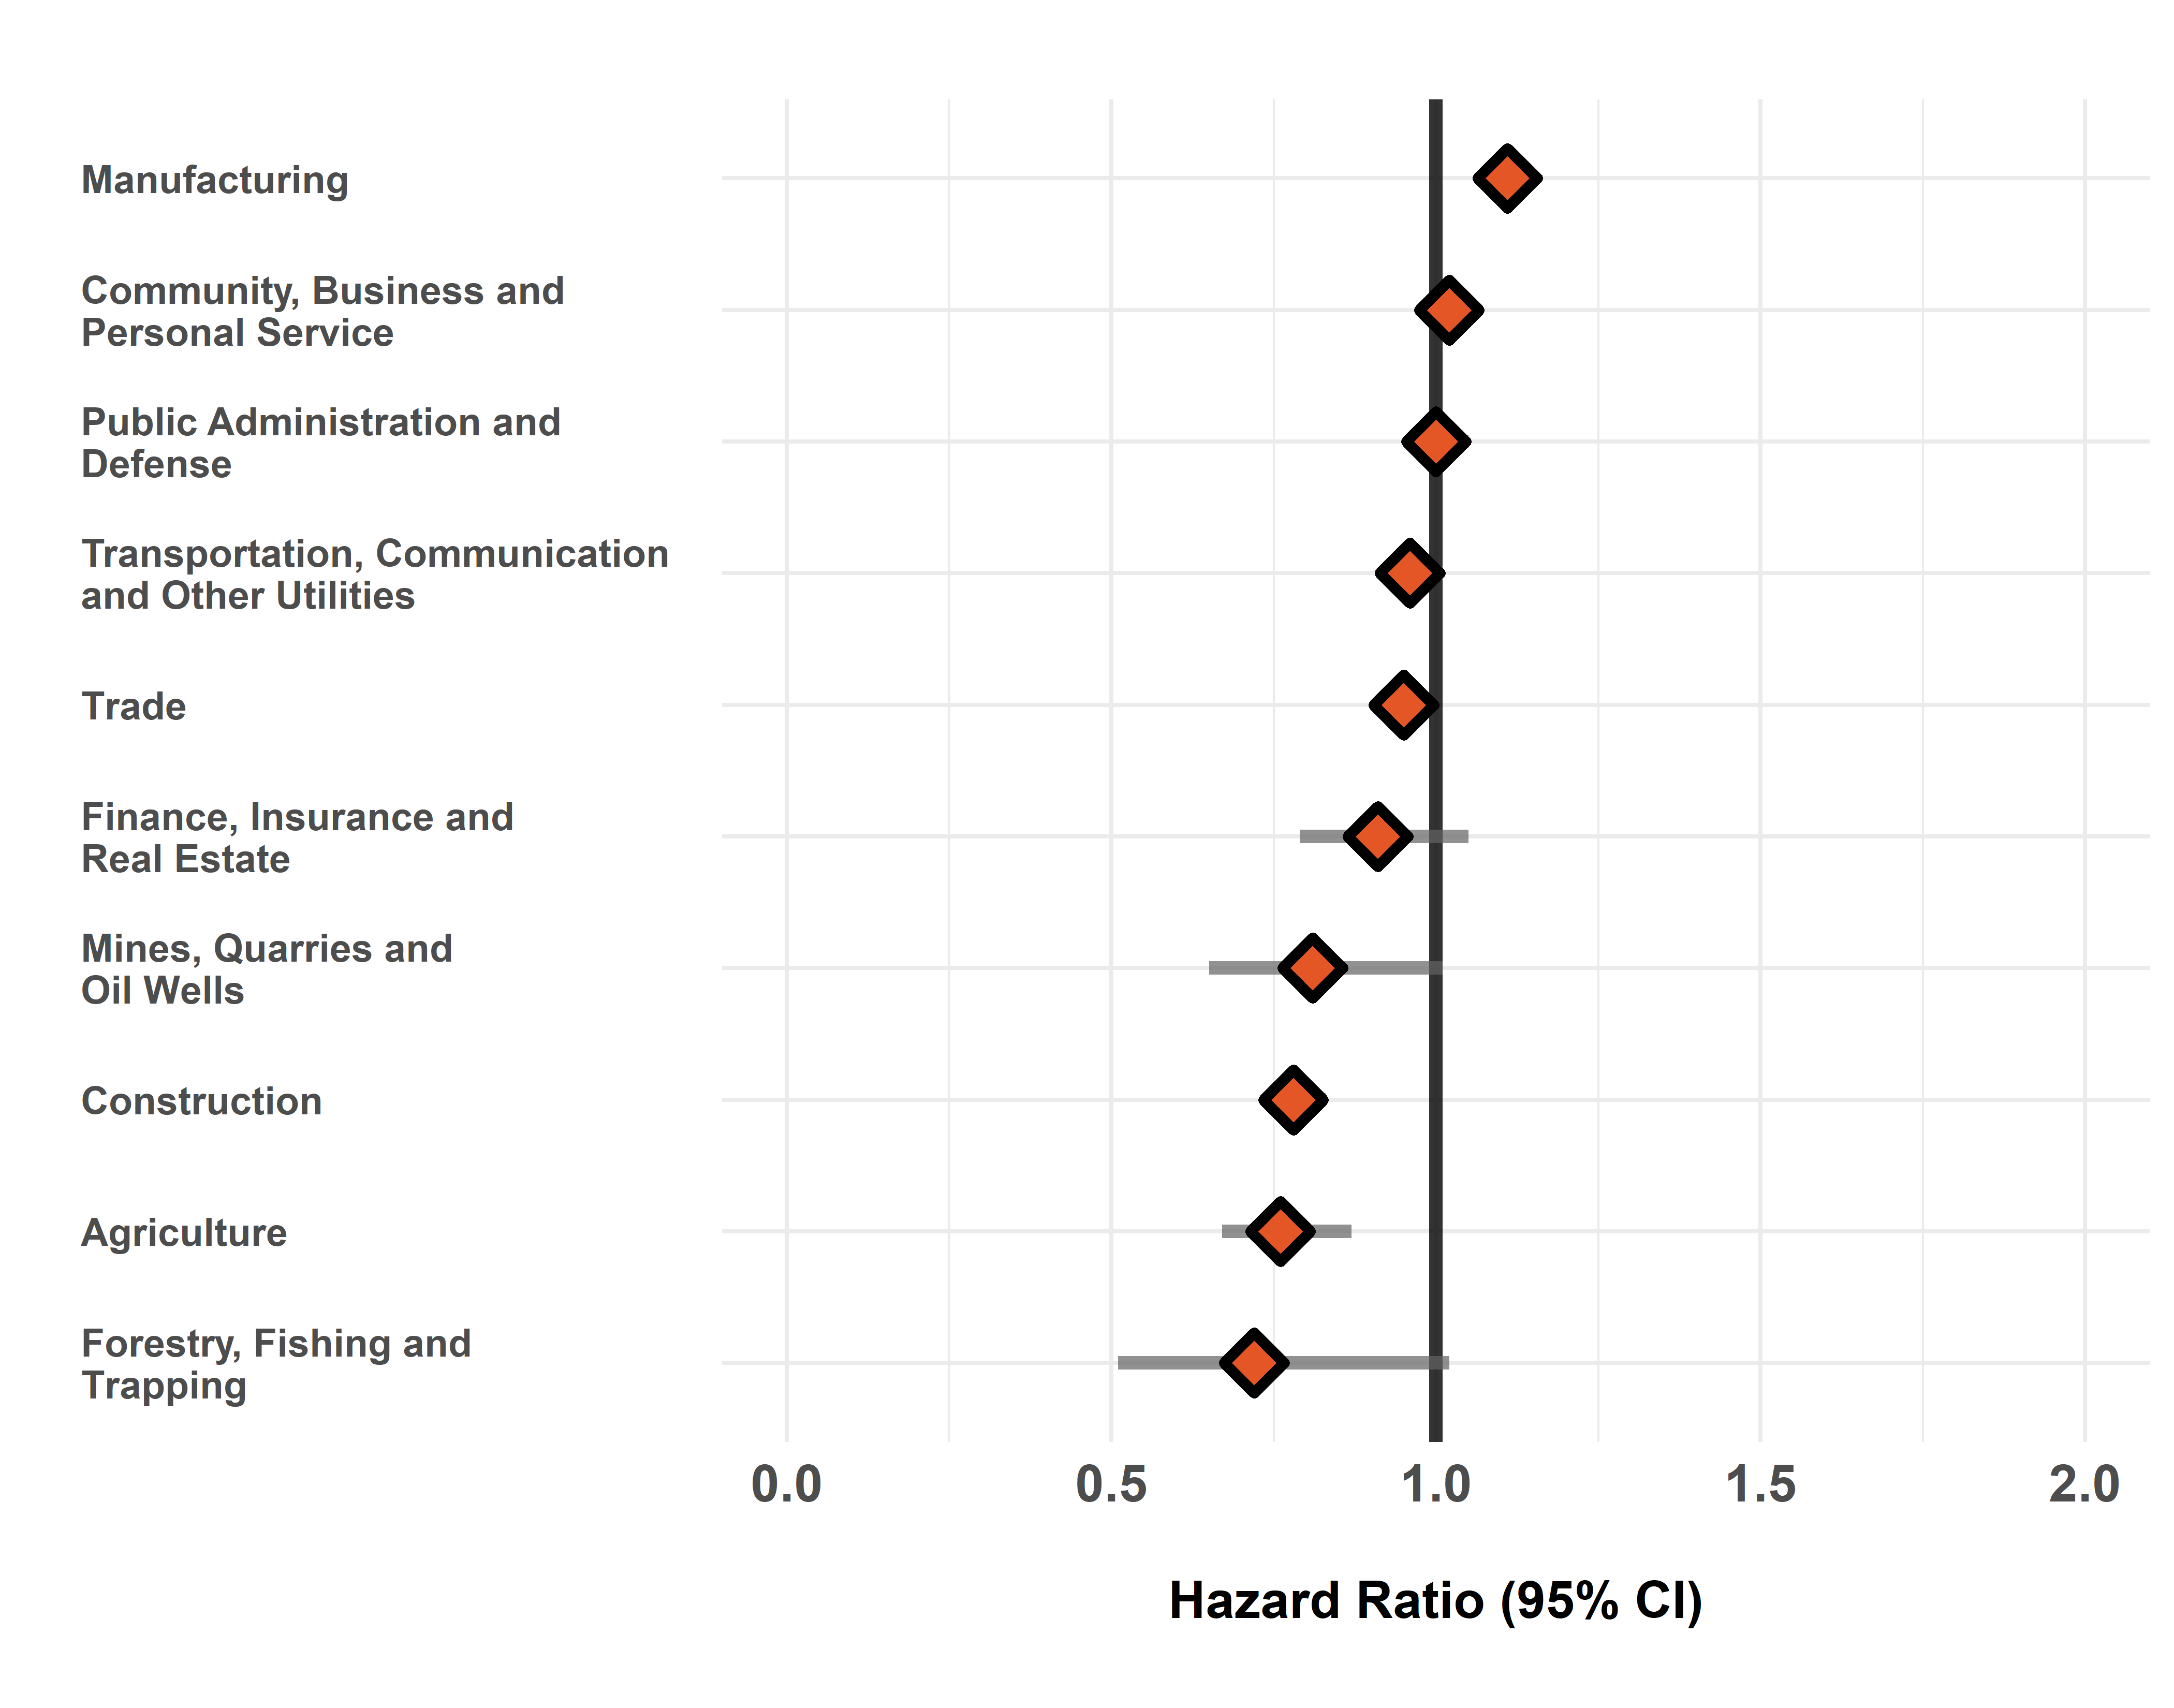
The hazard ratio is an estimate of the average time to diagnosis among workers in each industry/occupation group divided by that in all others during the study period. Hazard ratios above 1.00 indicate a greater incidence of disease in a given group compared to all others. Estimates are adjusted for birth year and sex. The width of the 95% Confidence Interval (CI) is based on the number of cases in each group (more cases narrows the interval).
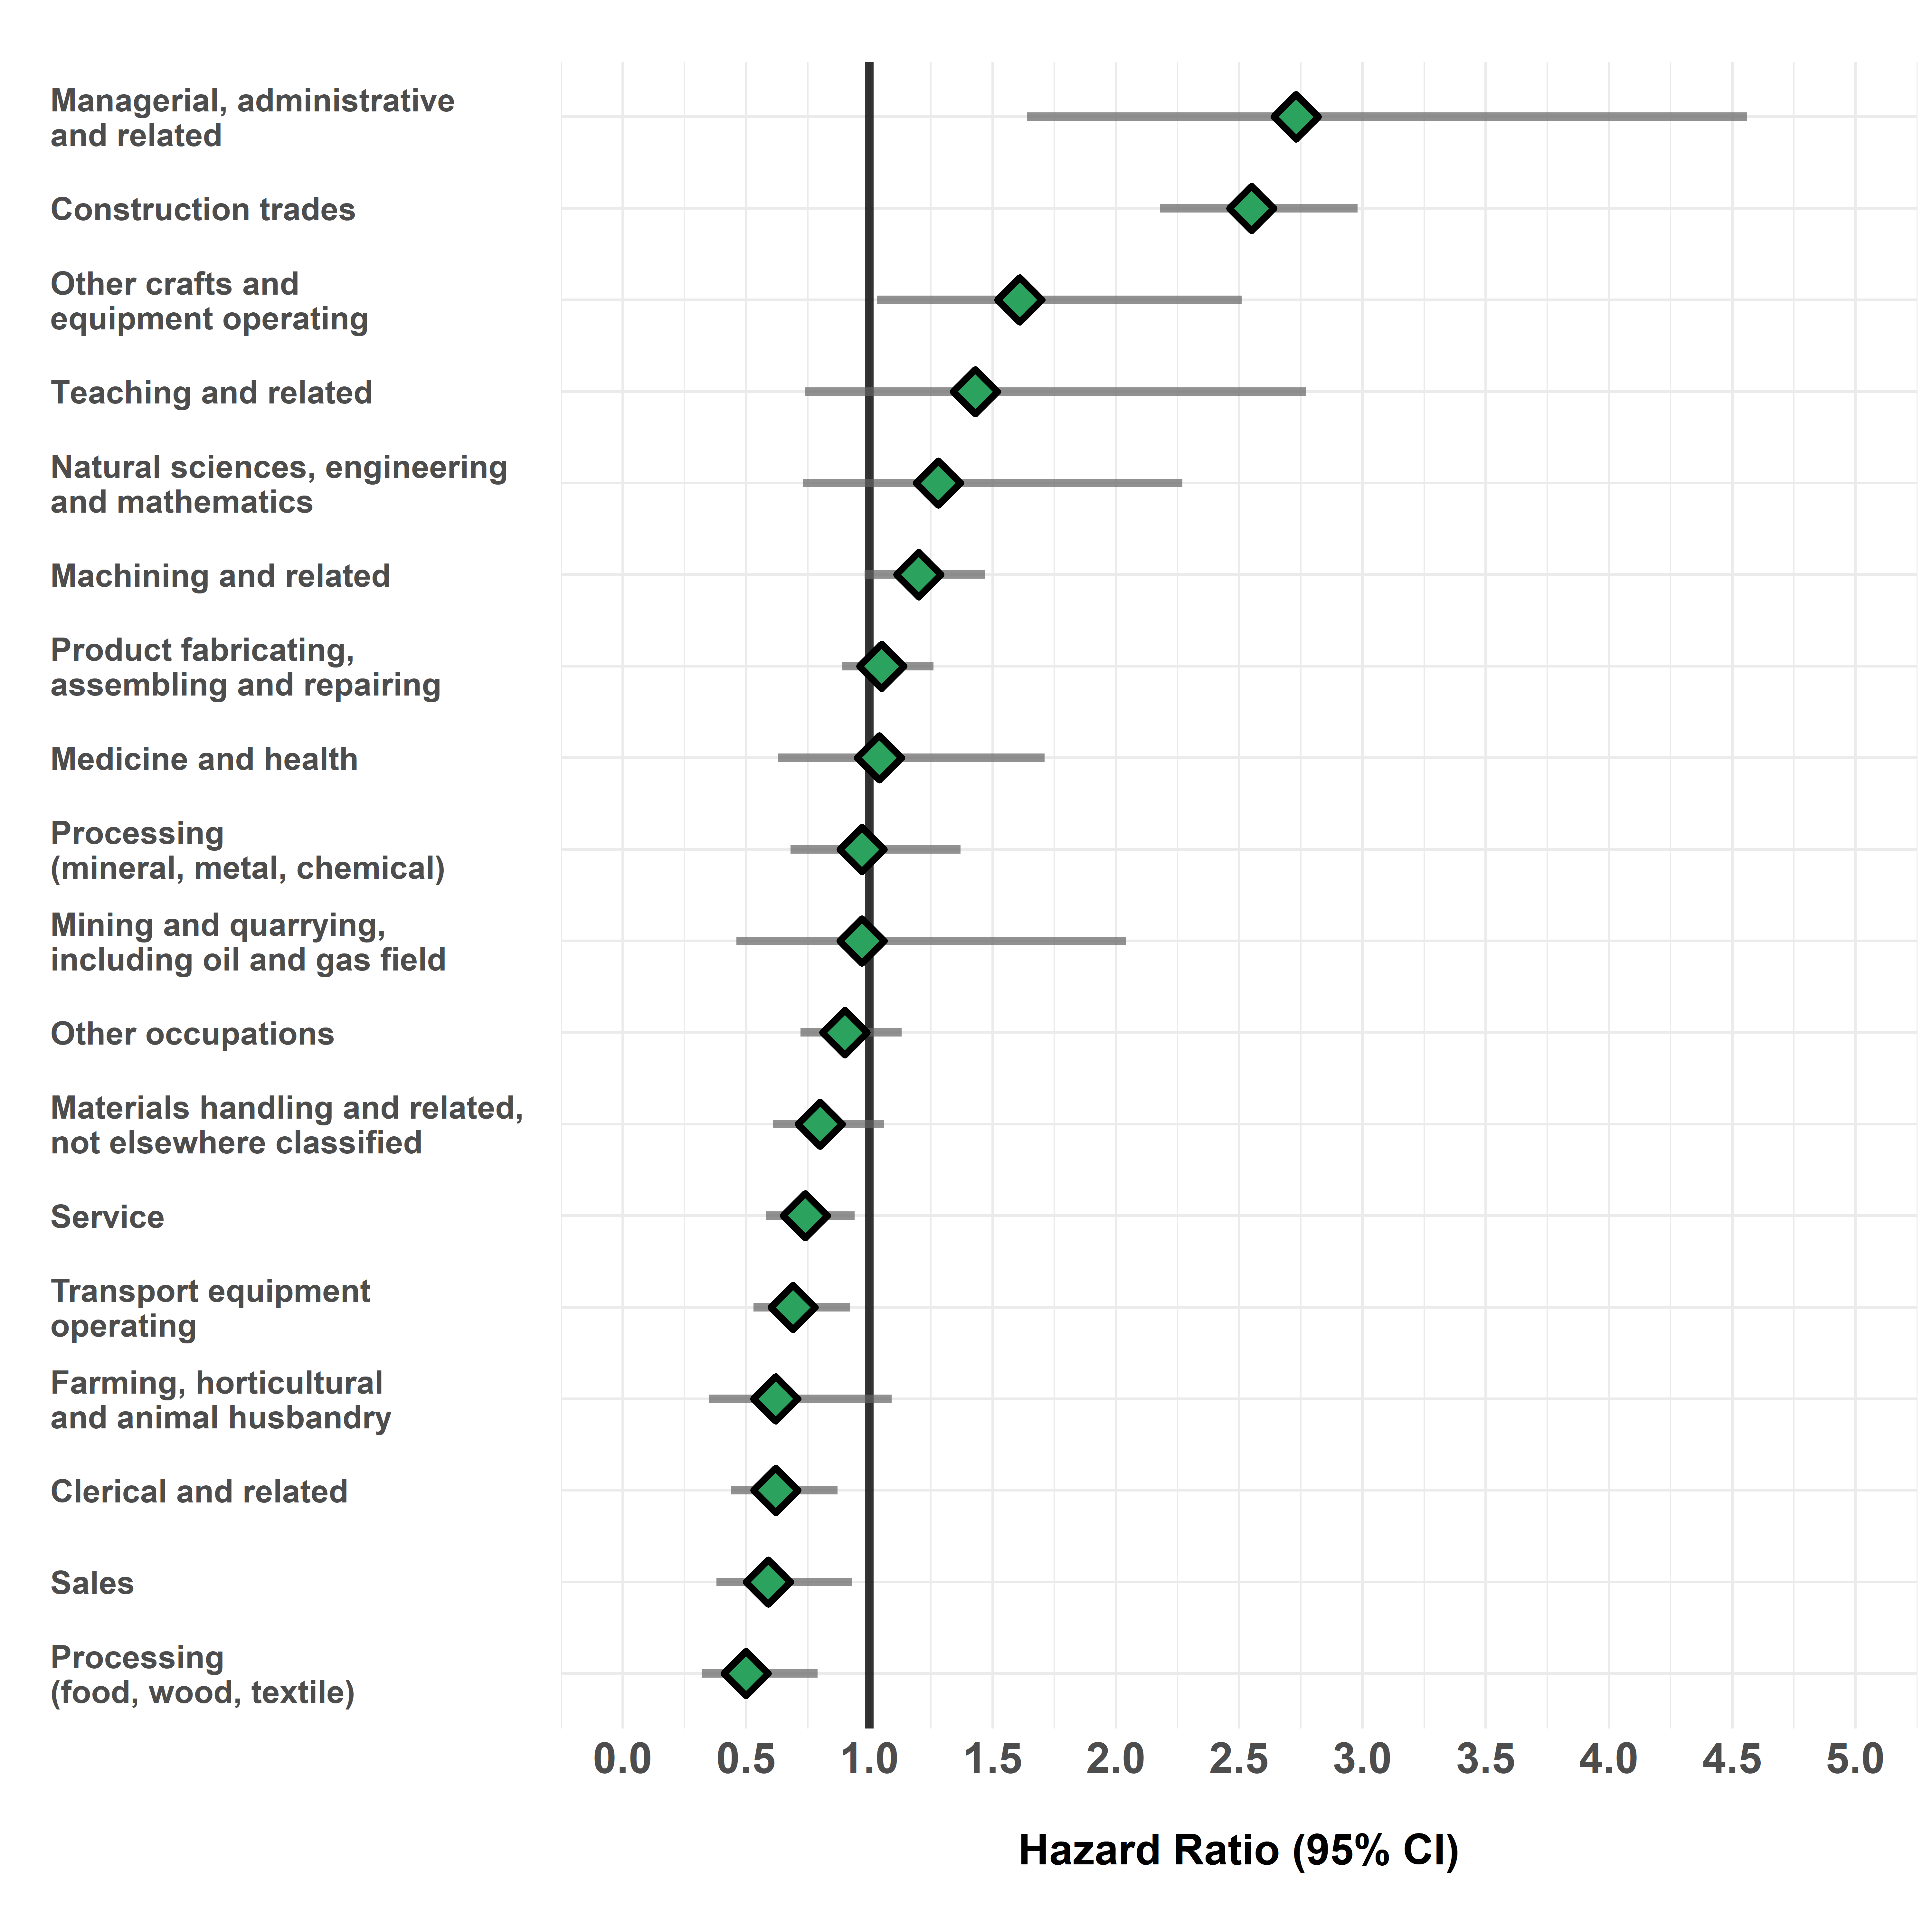
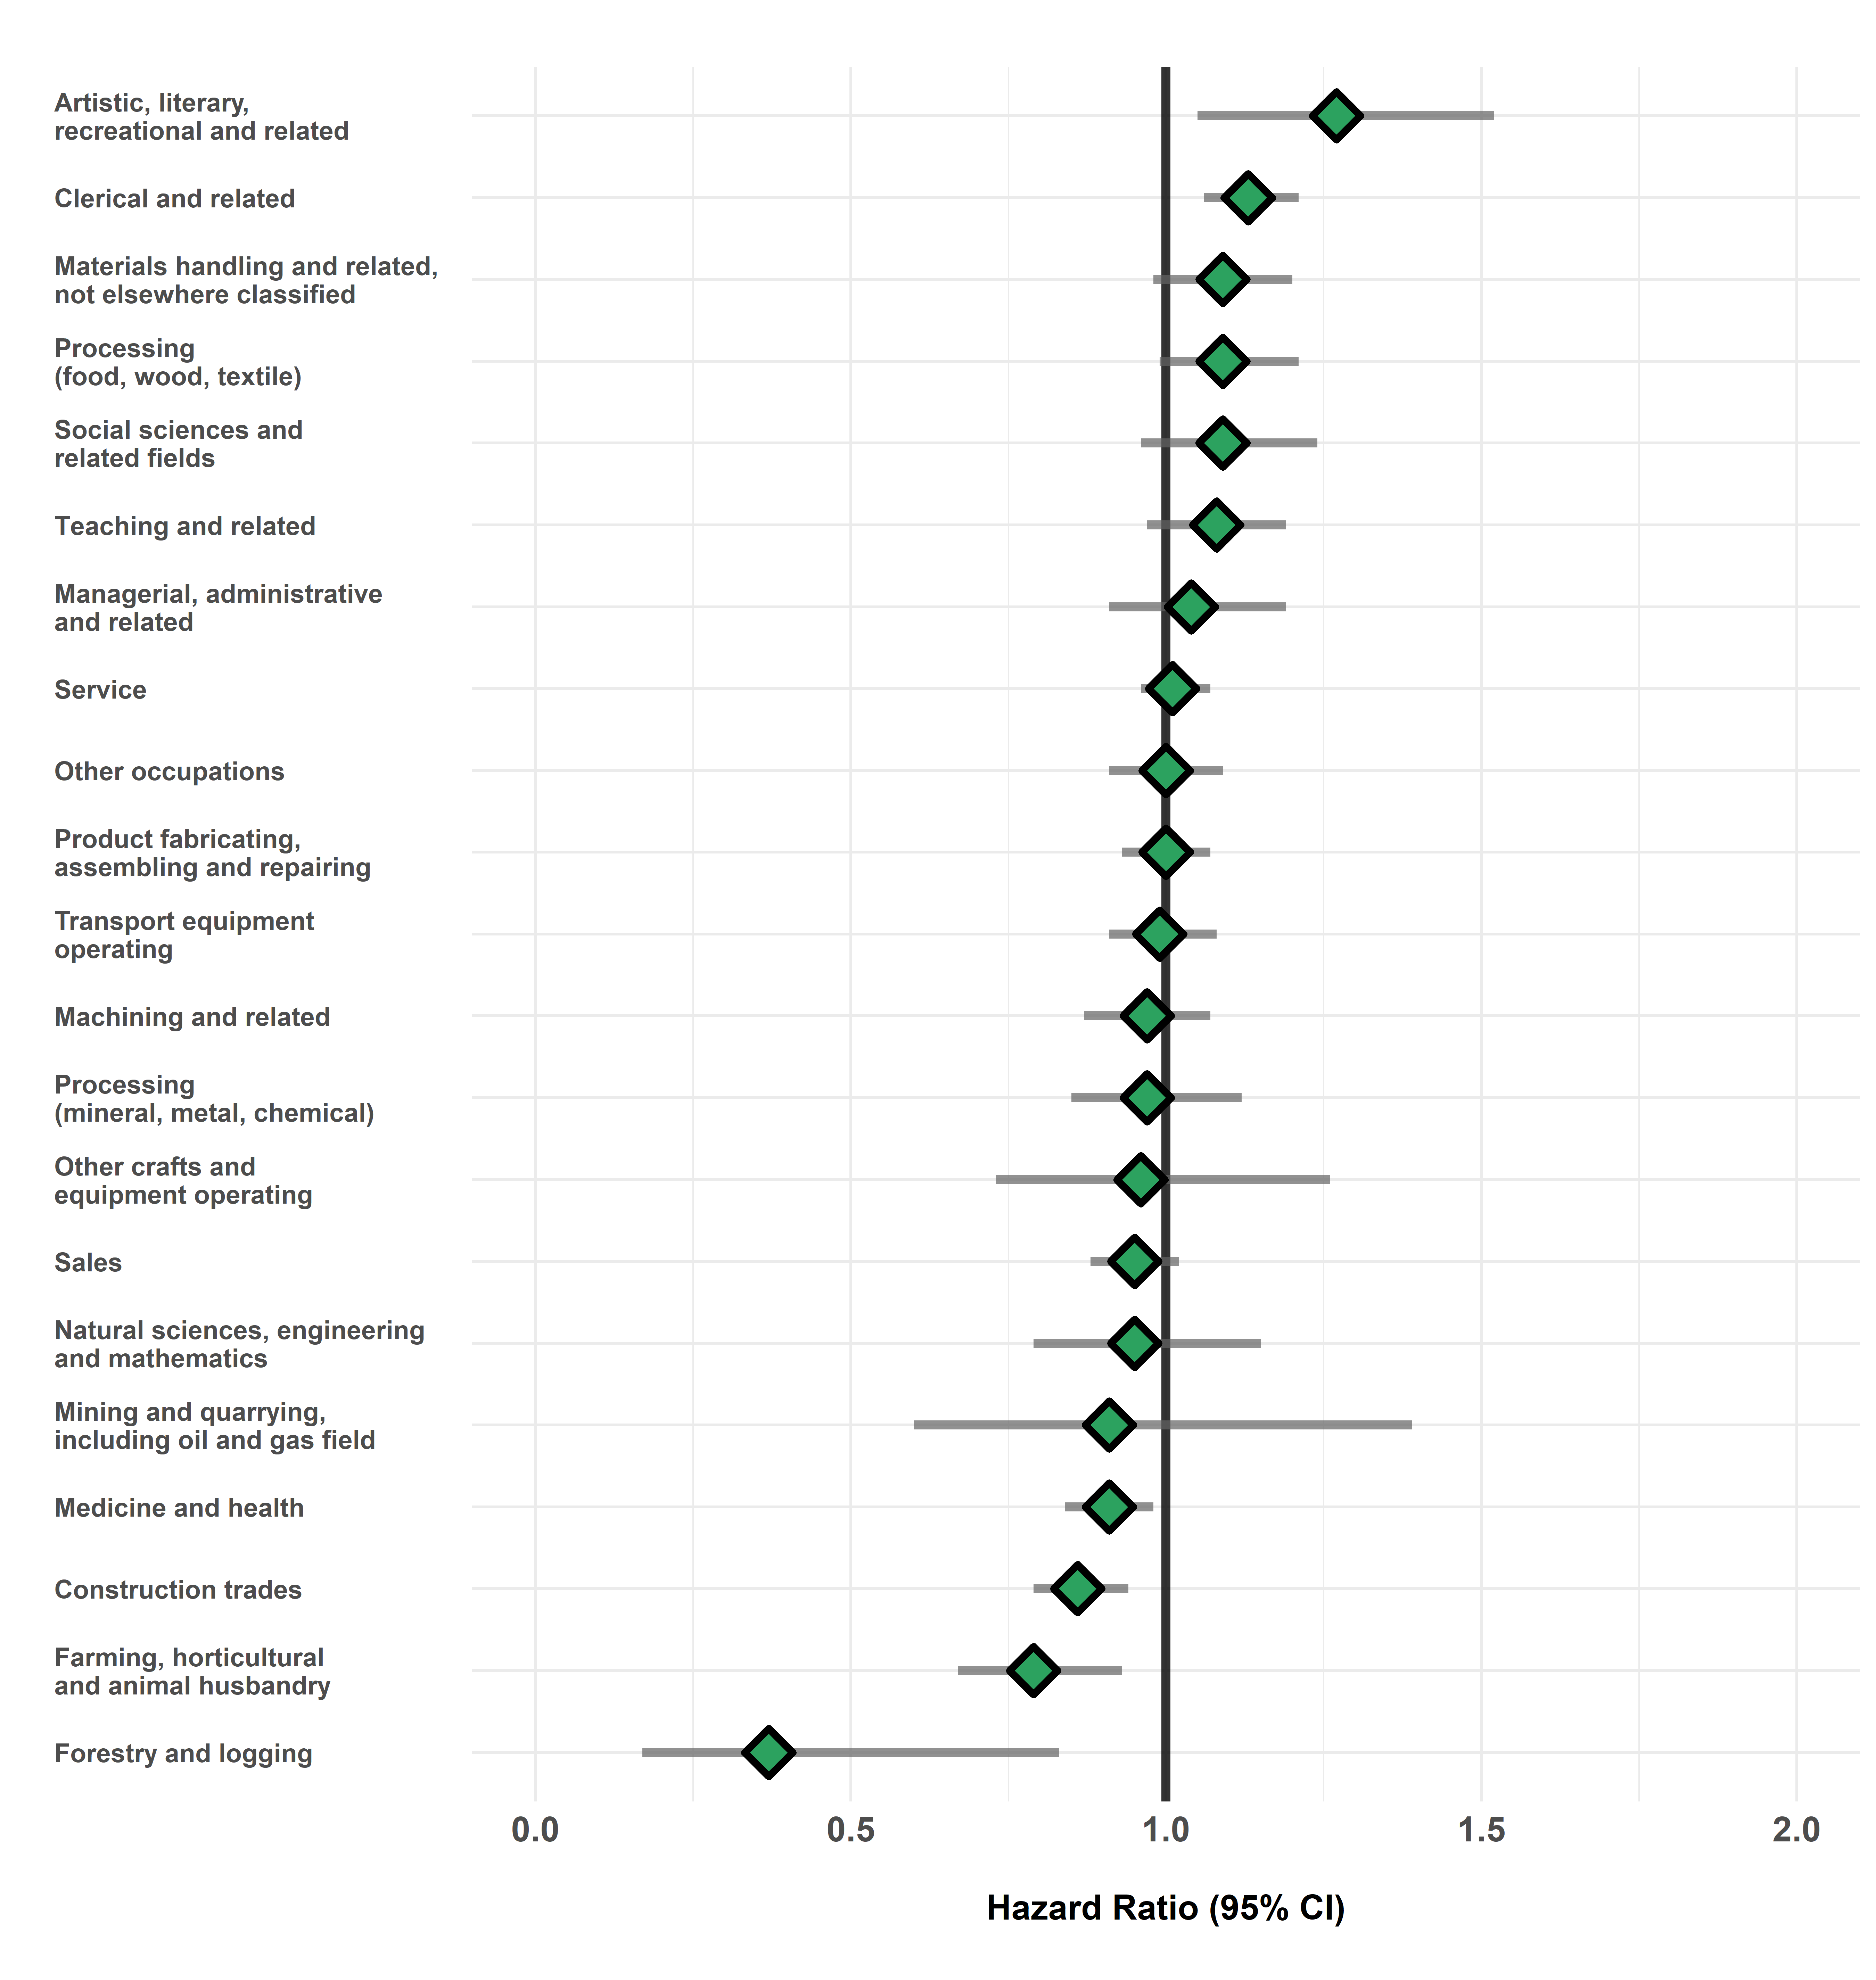
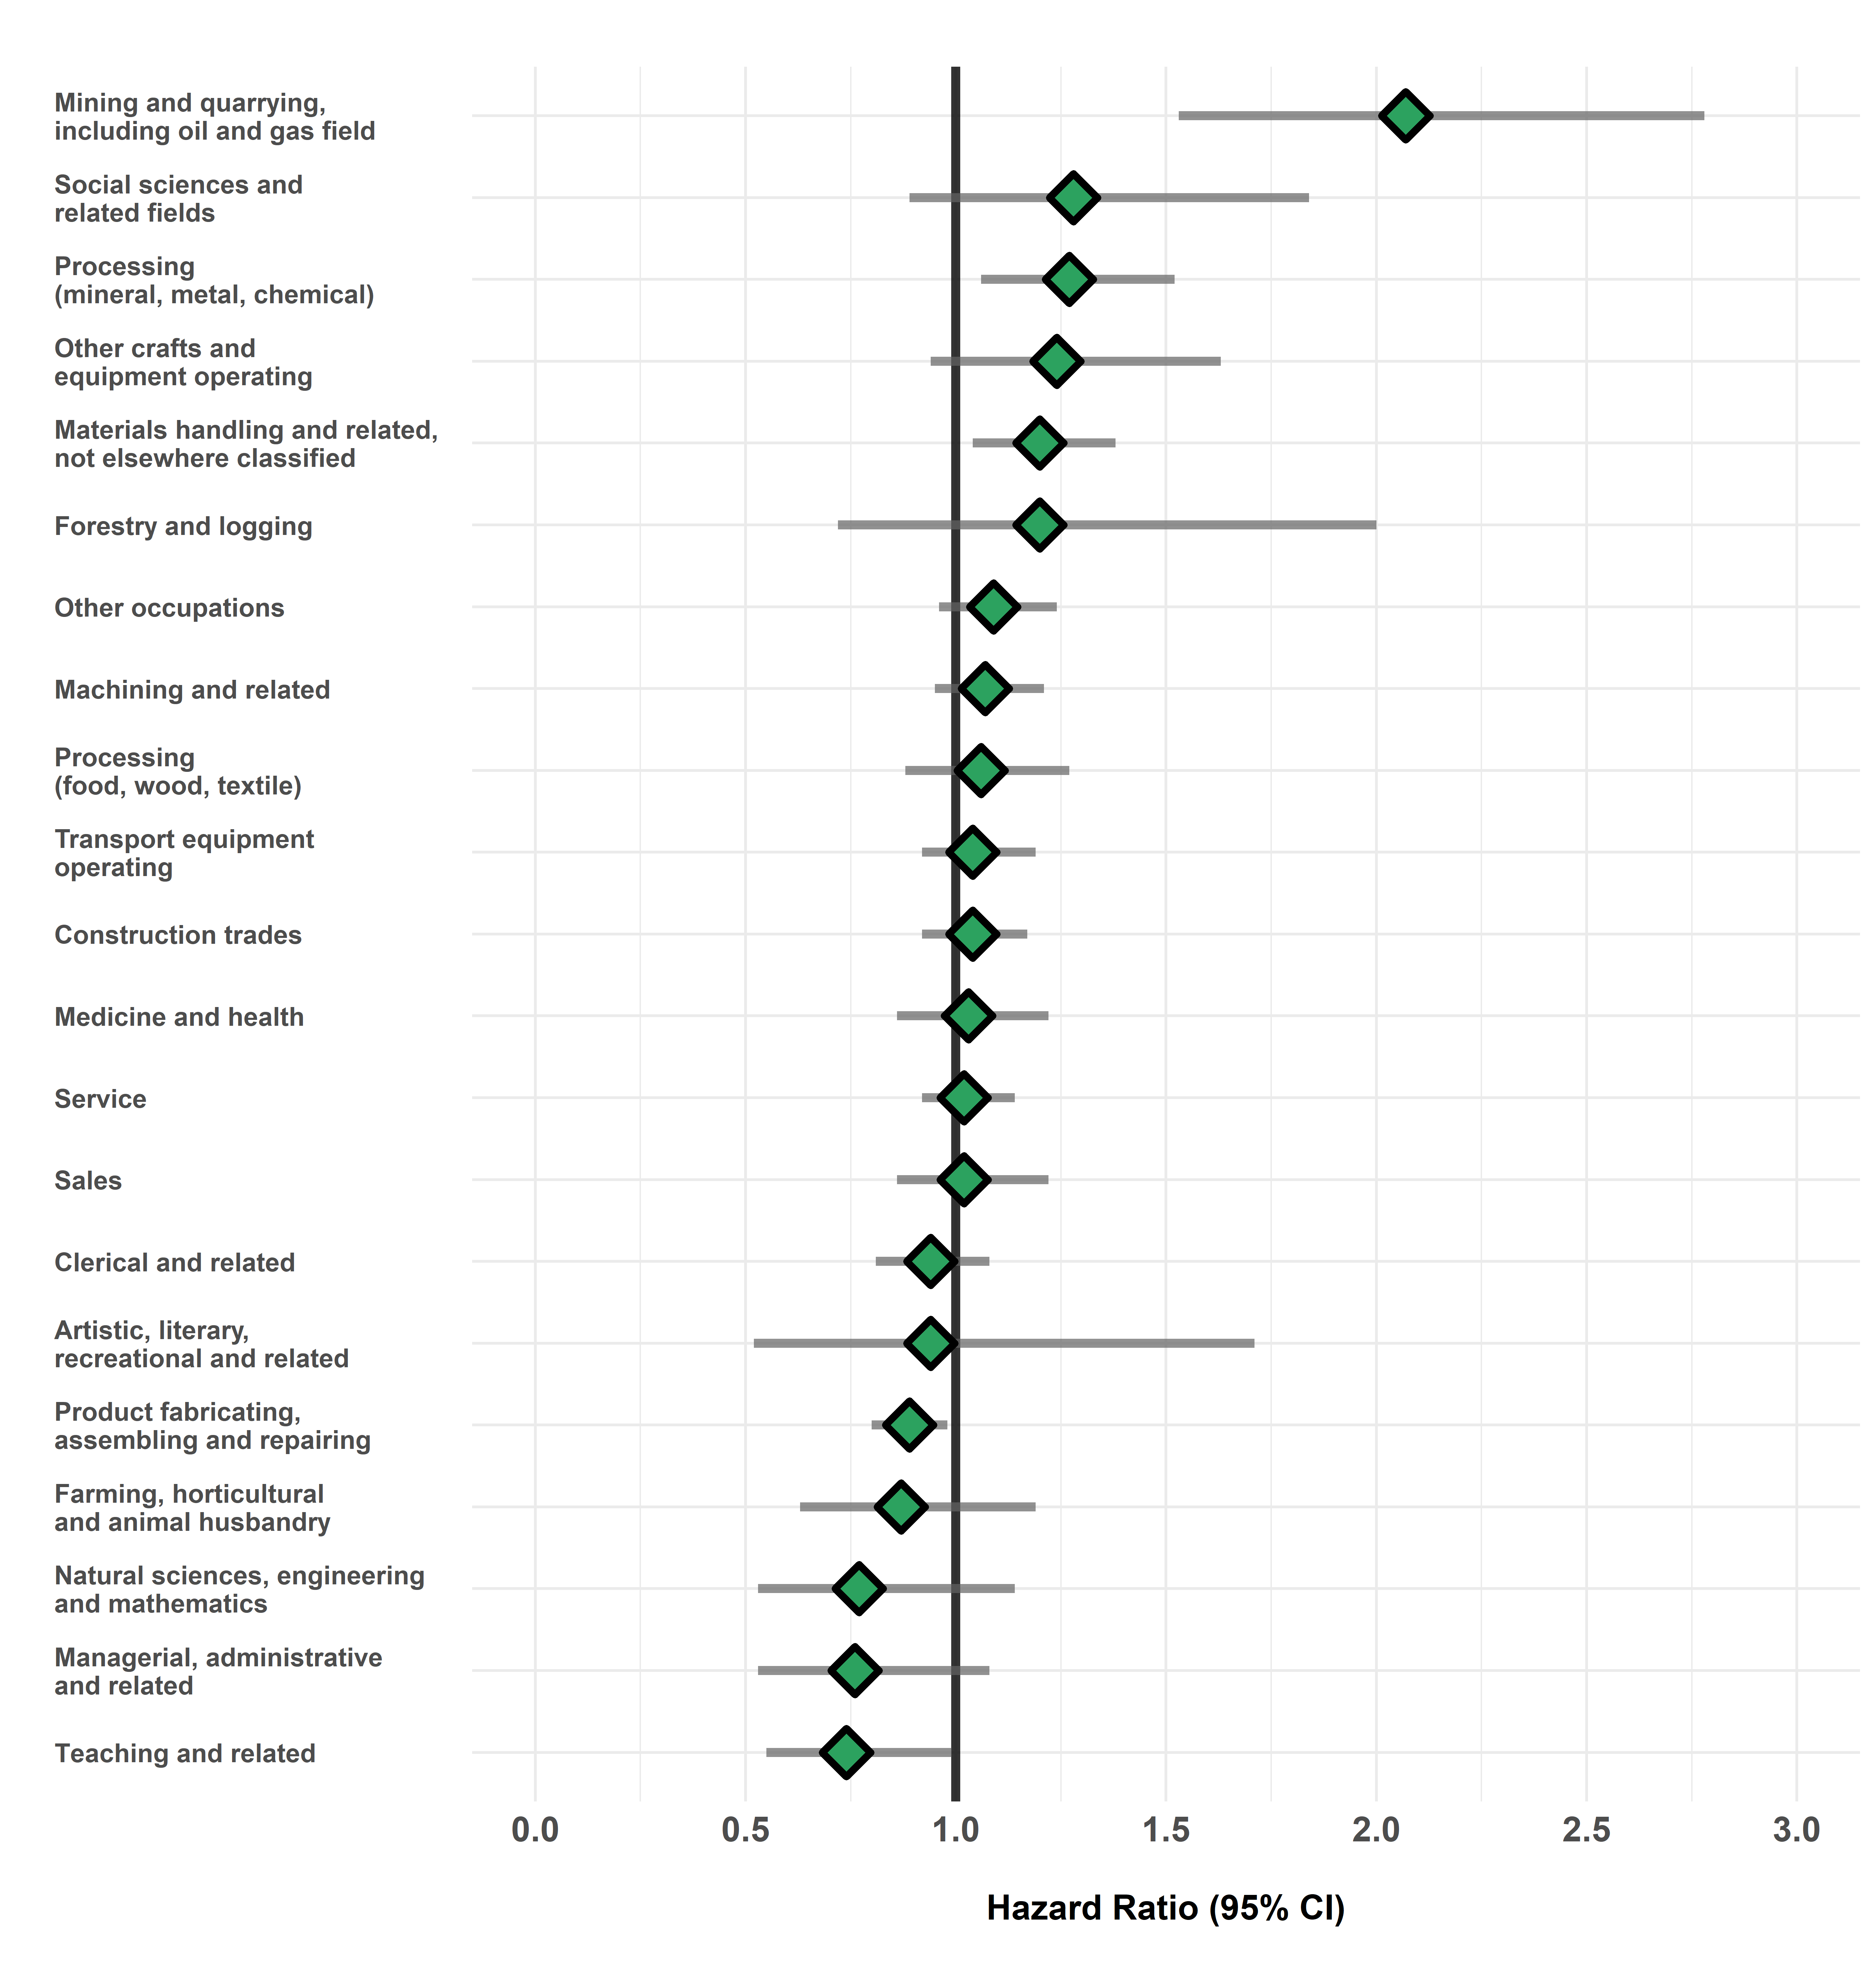
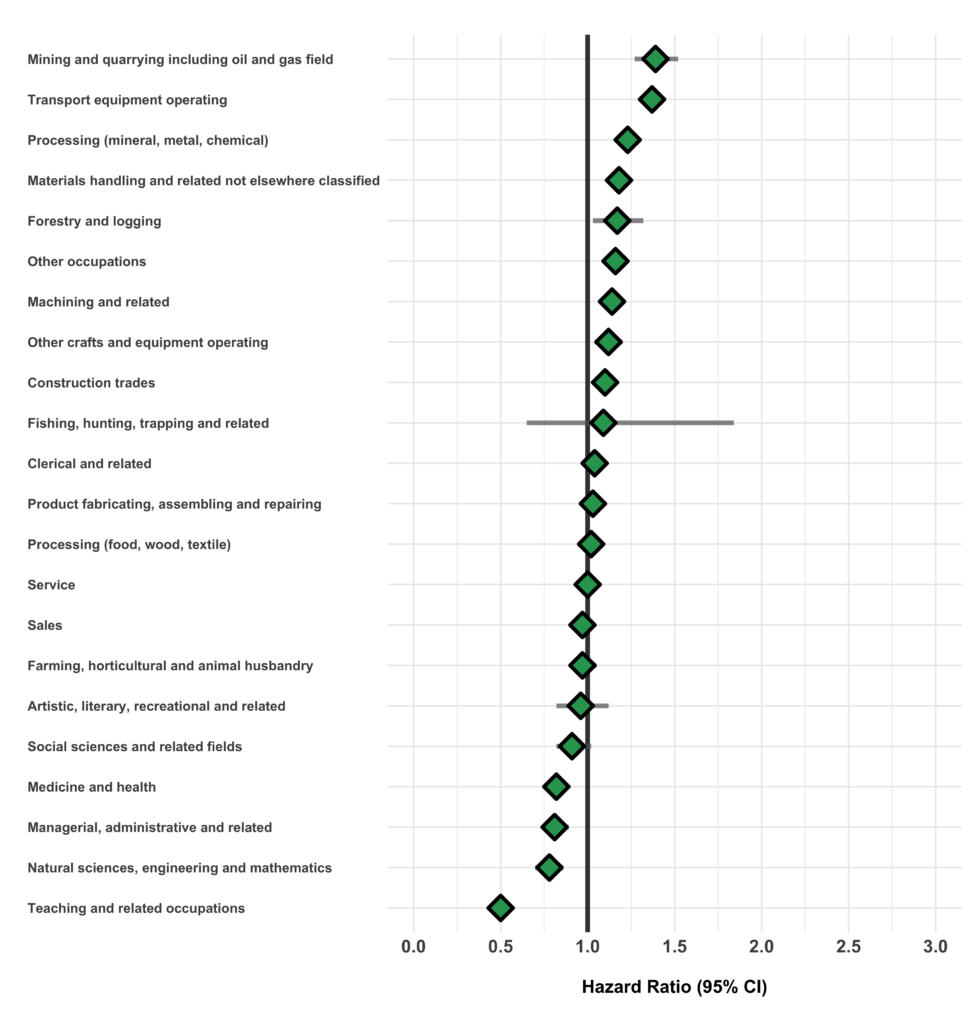
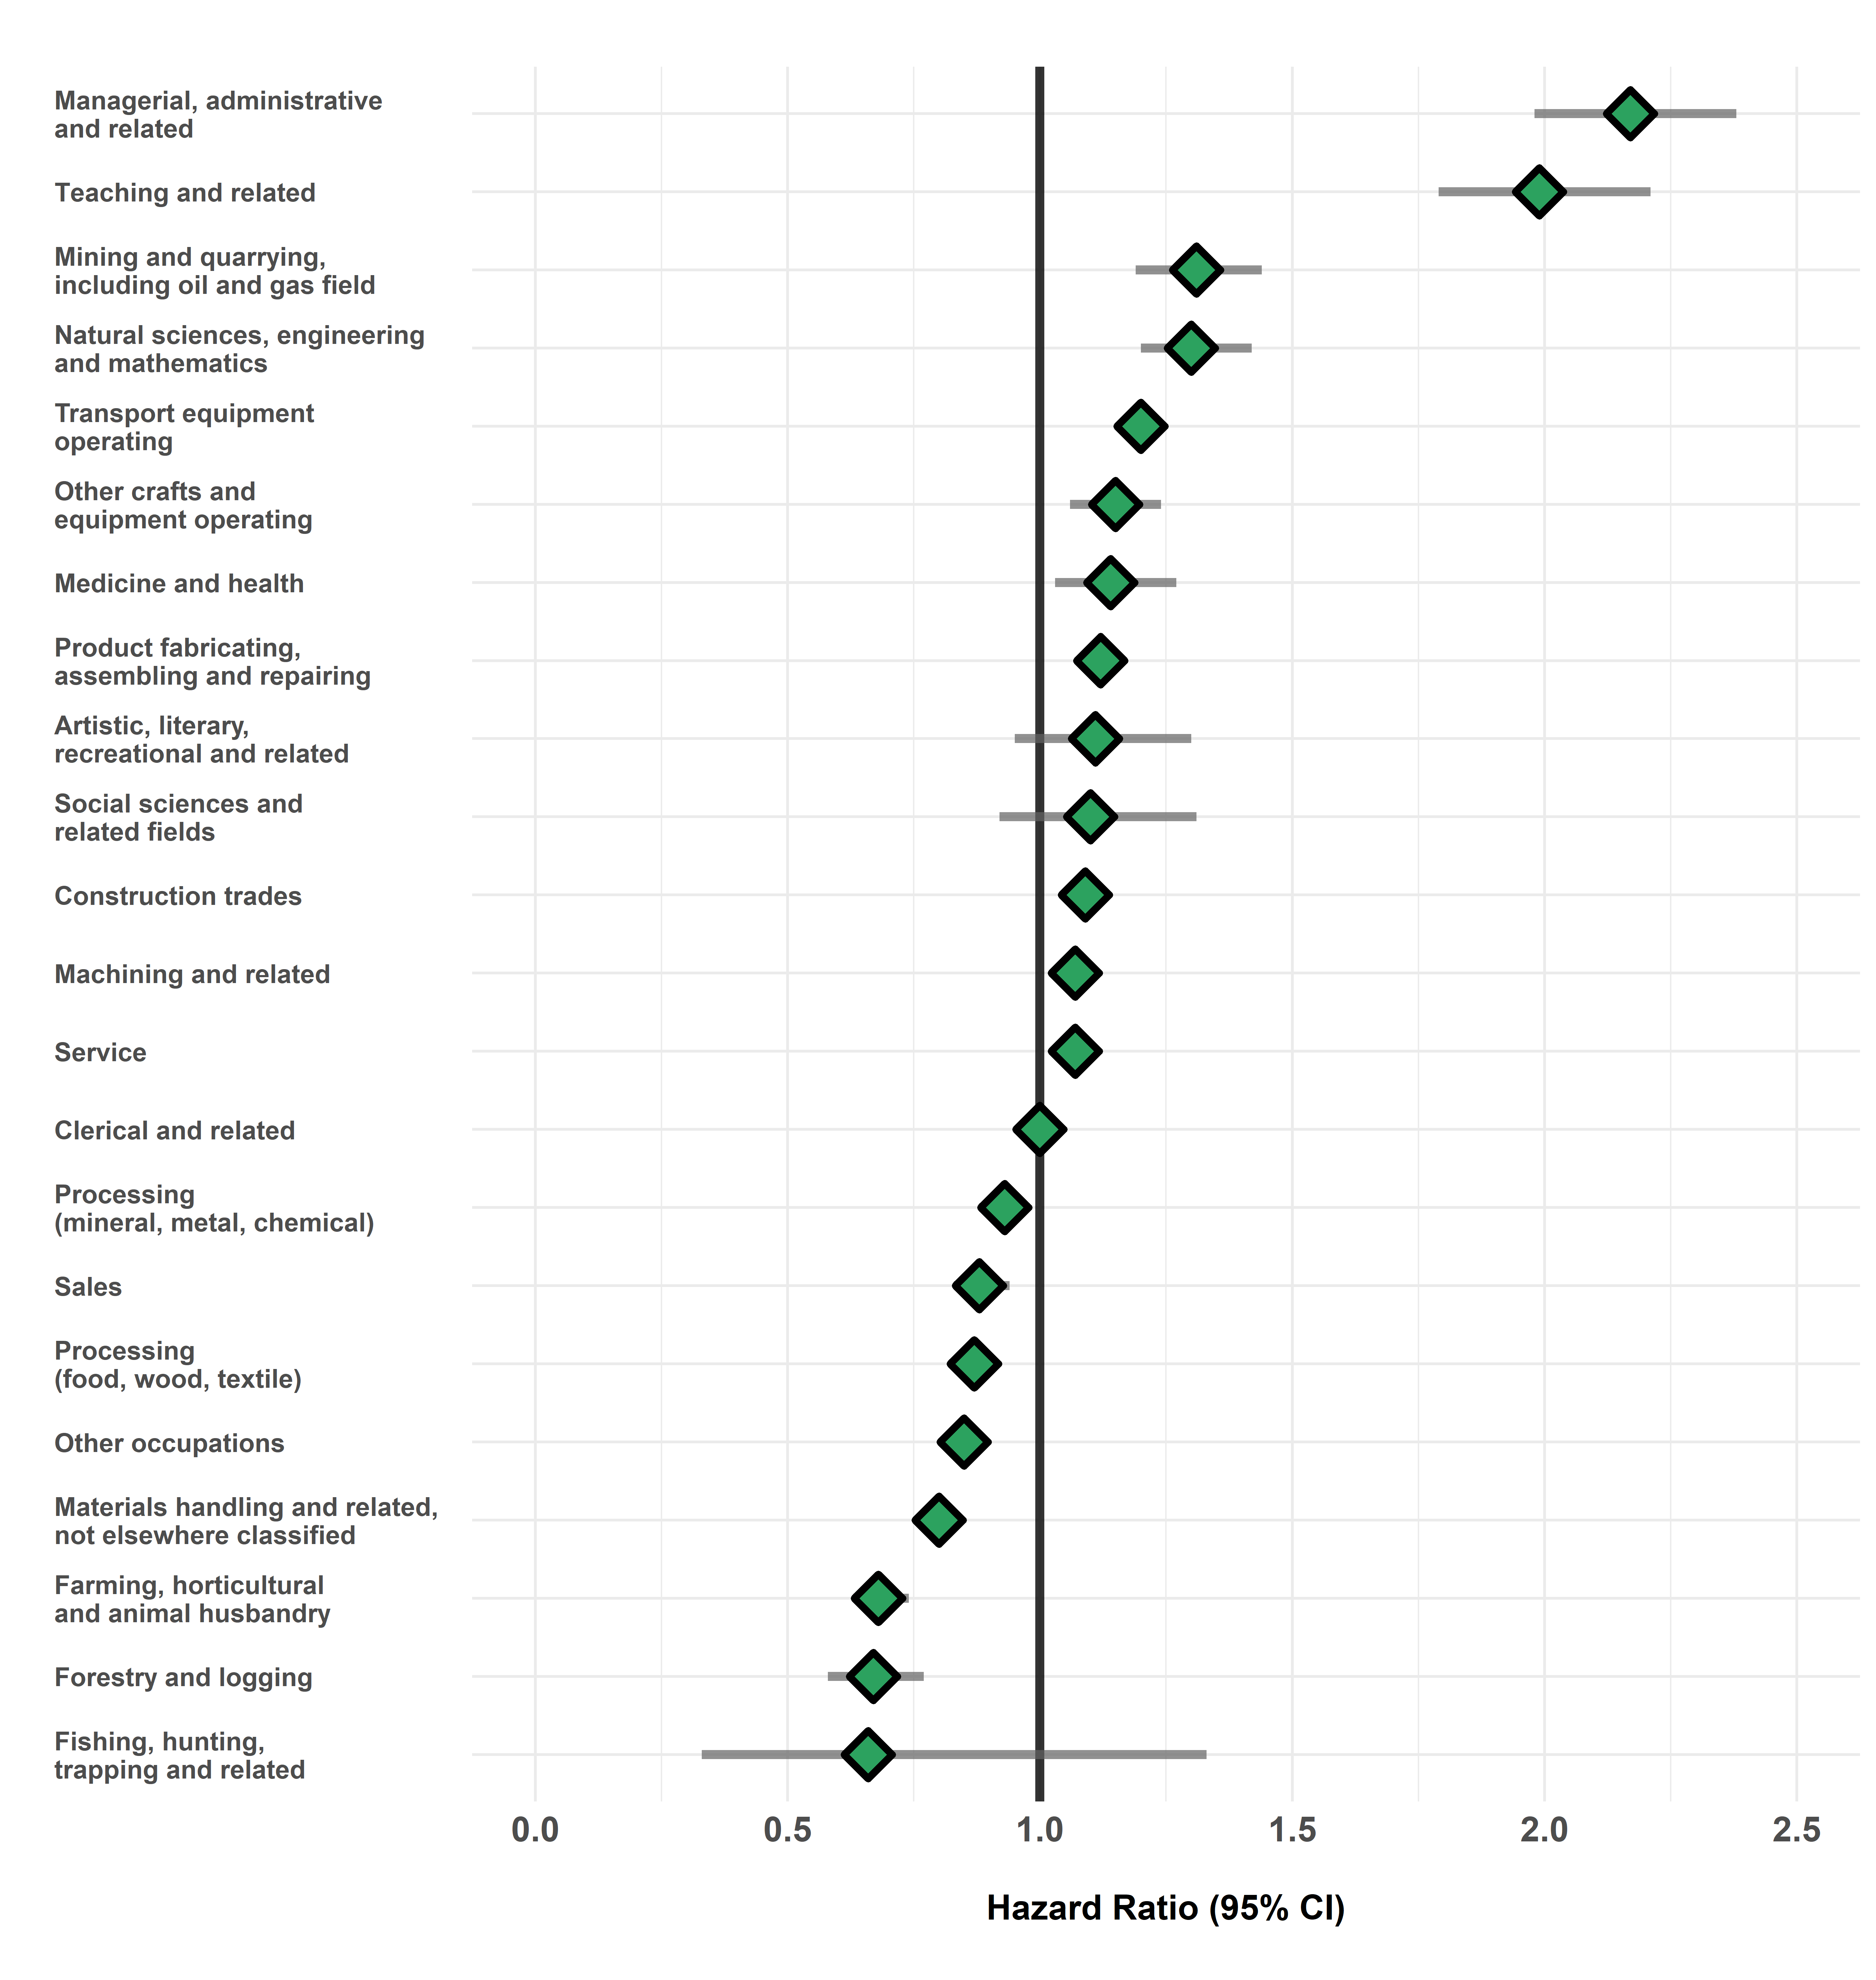
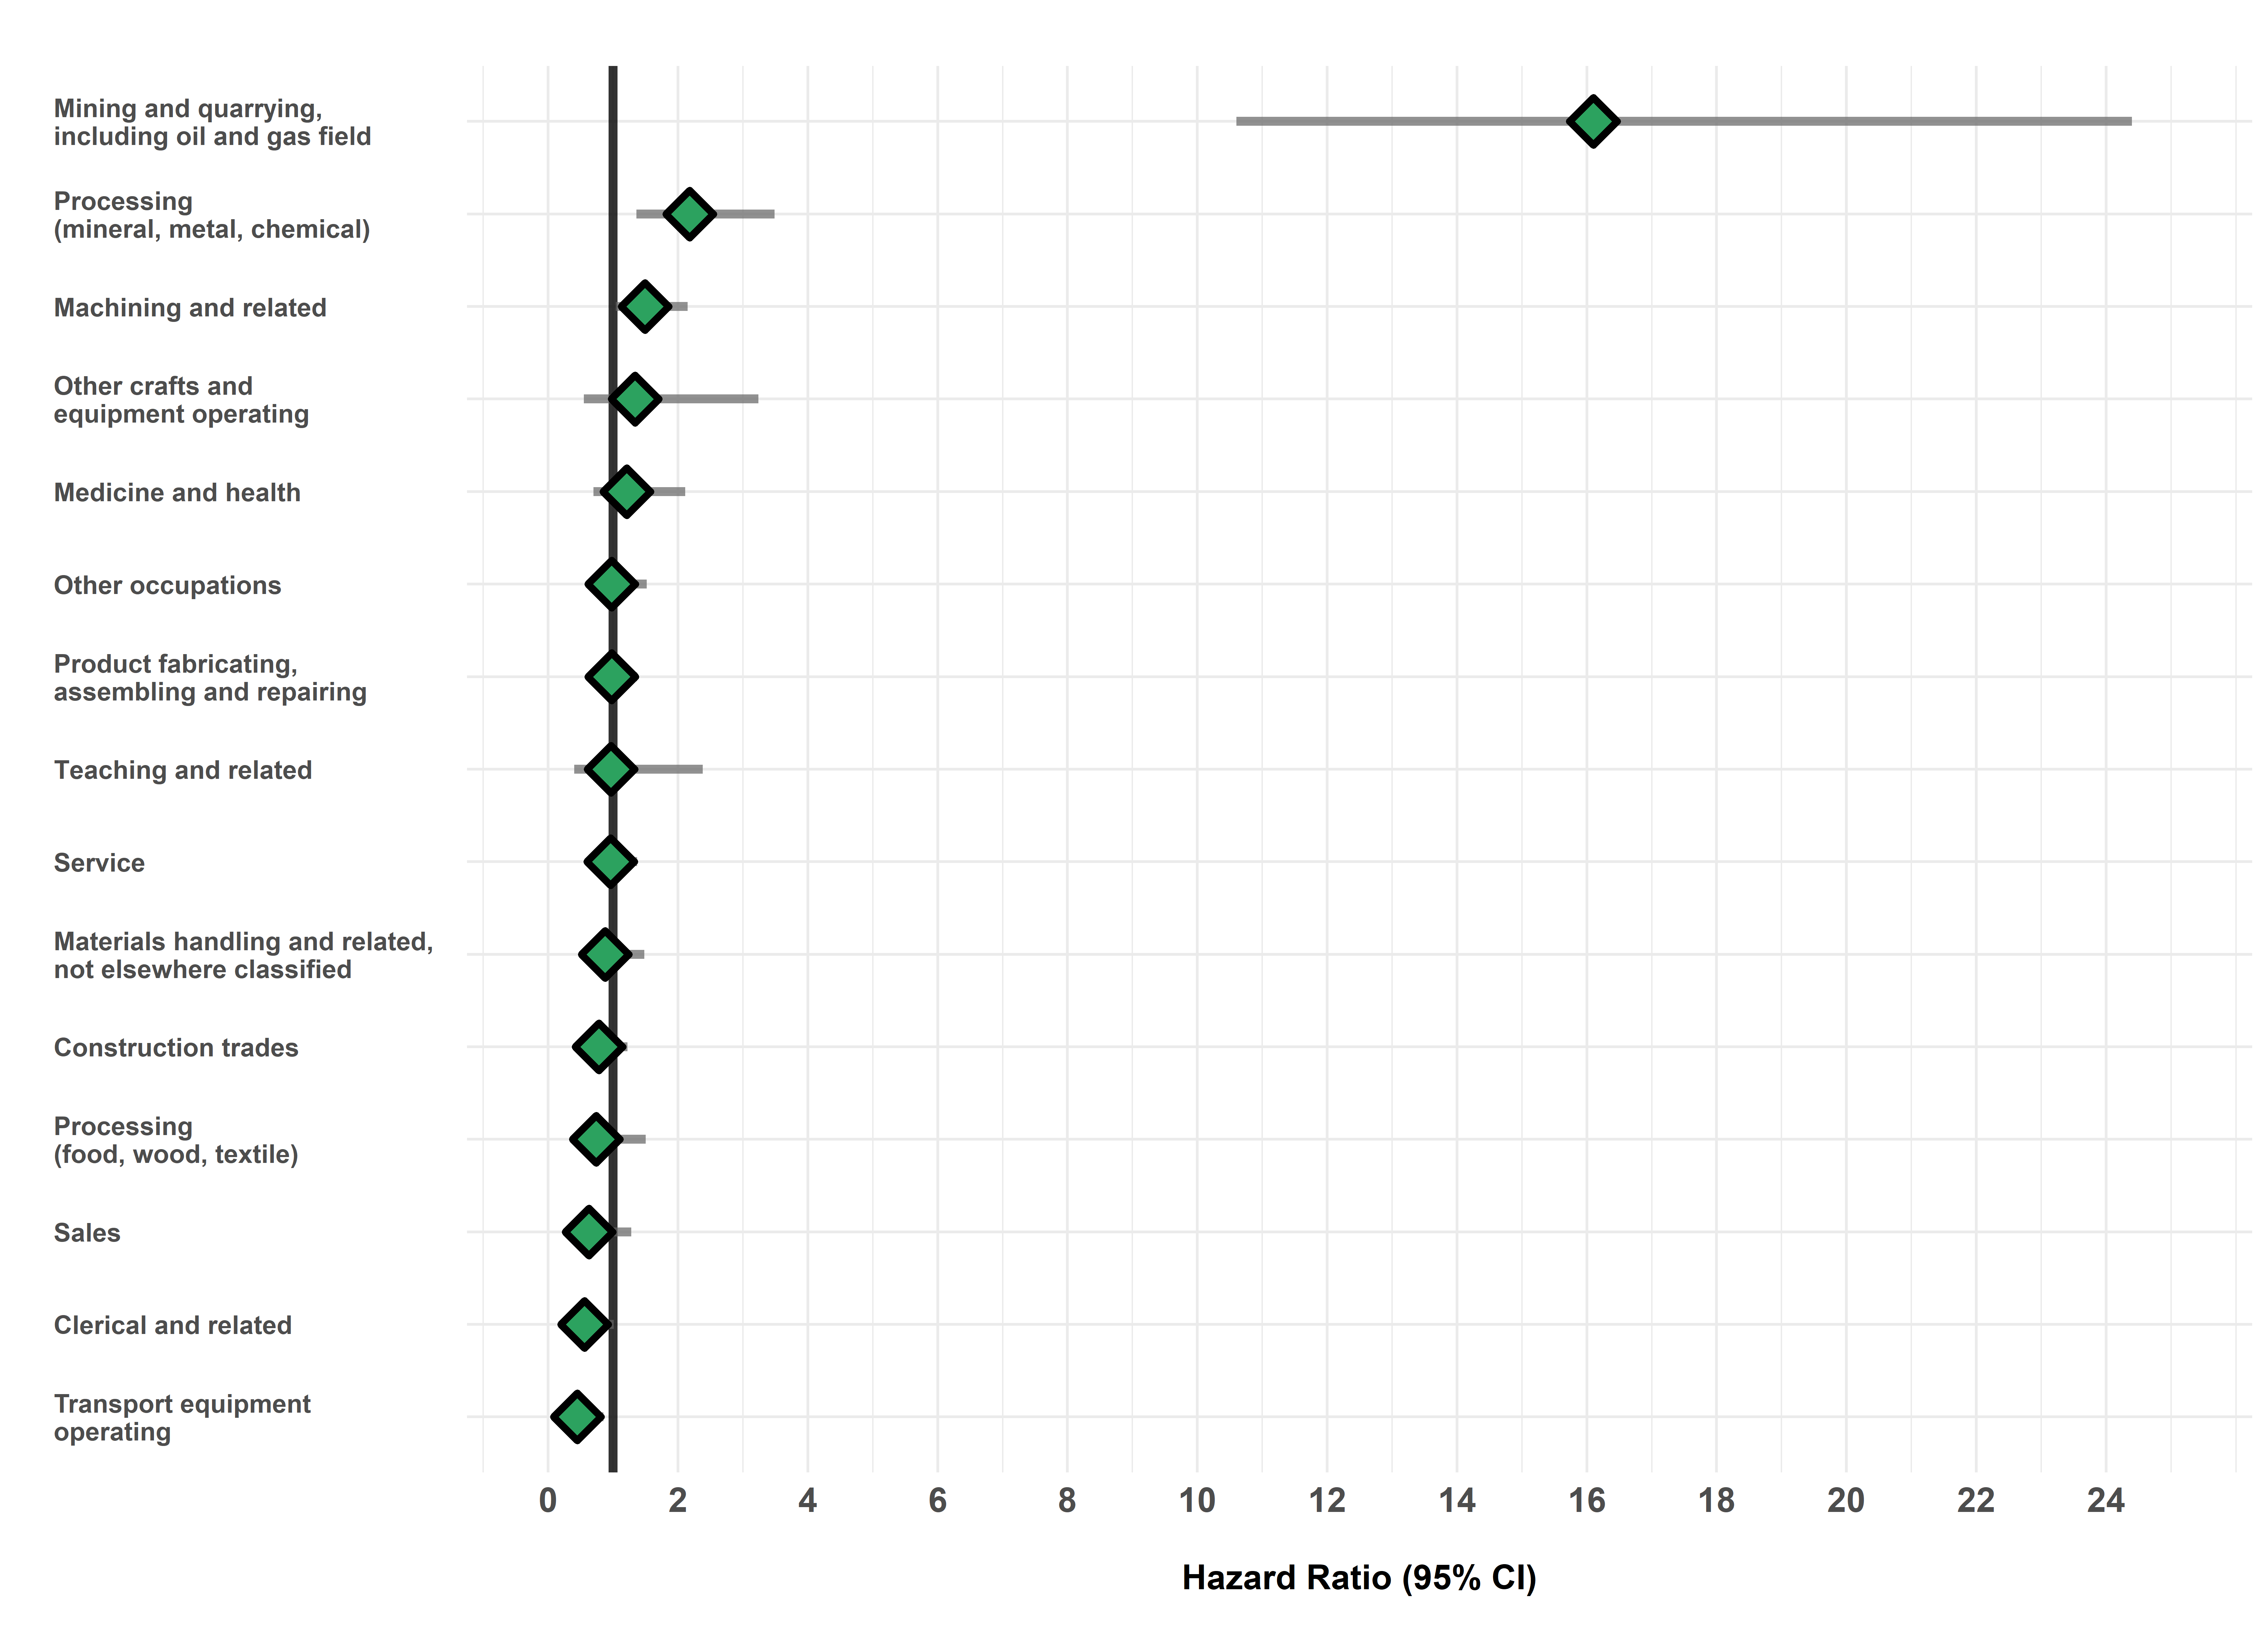
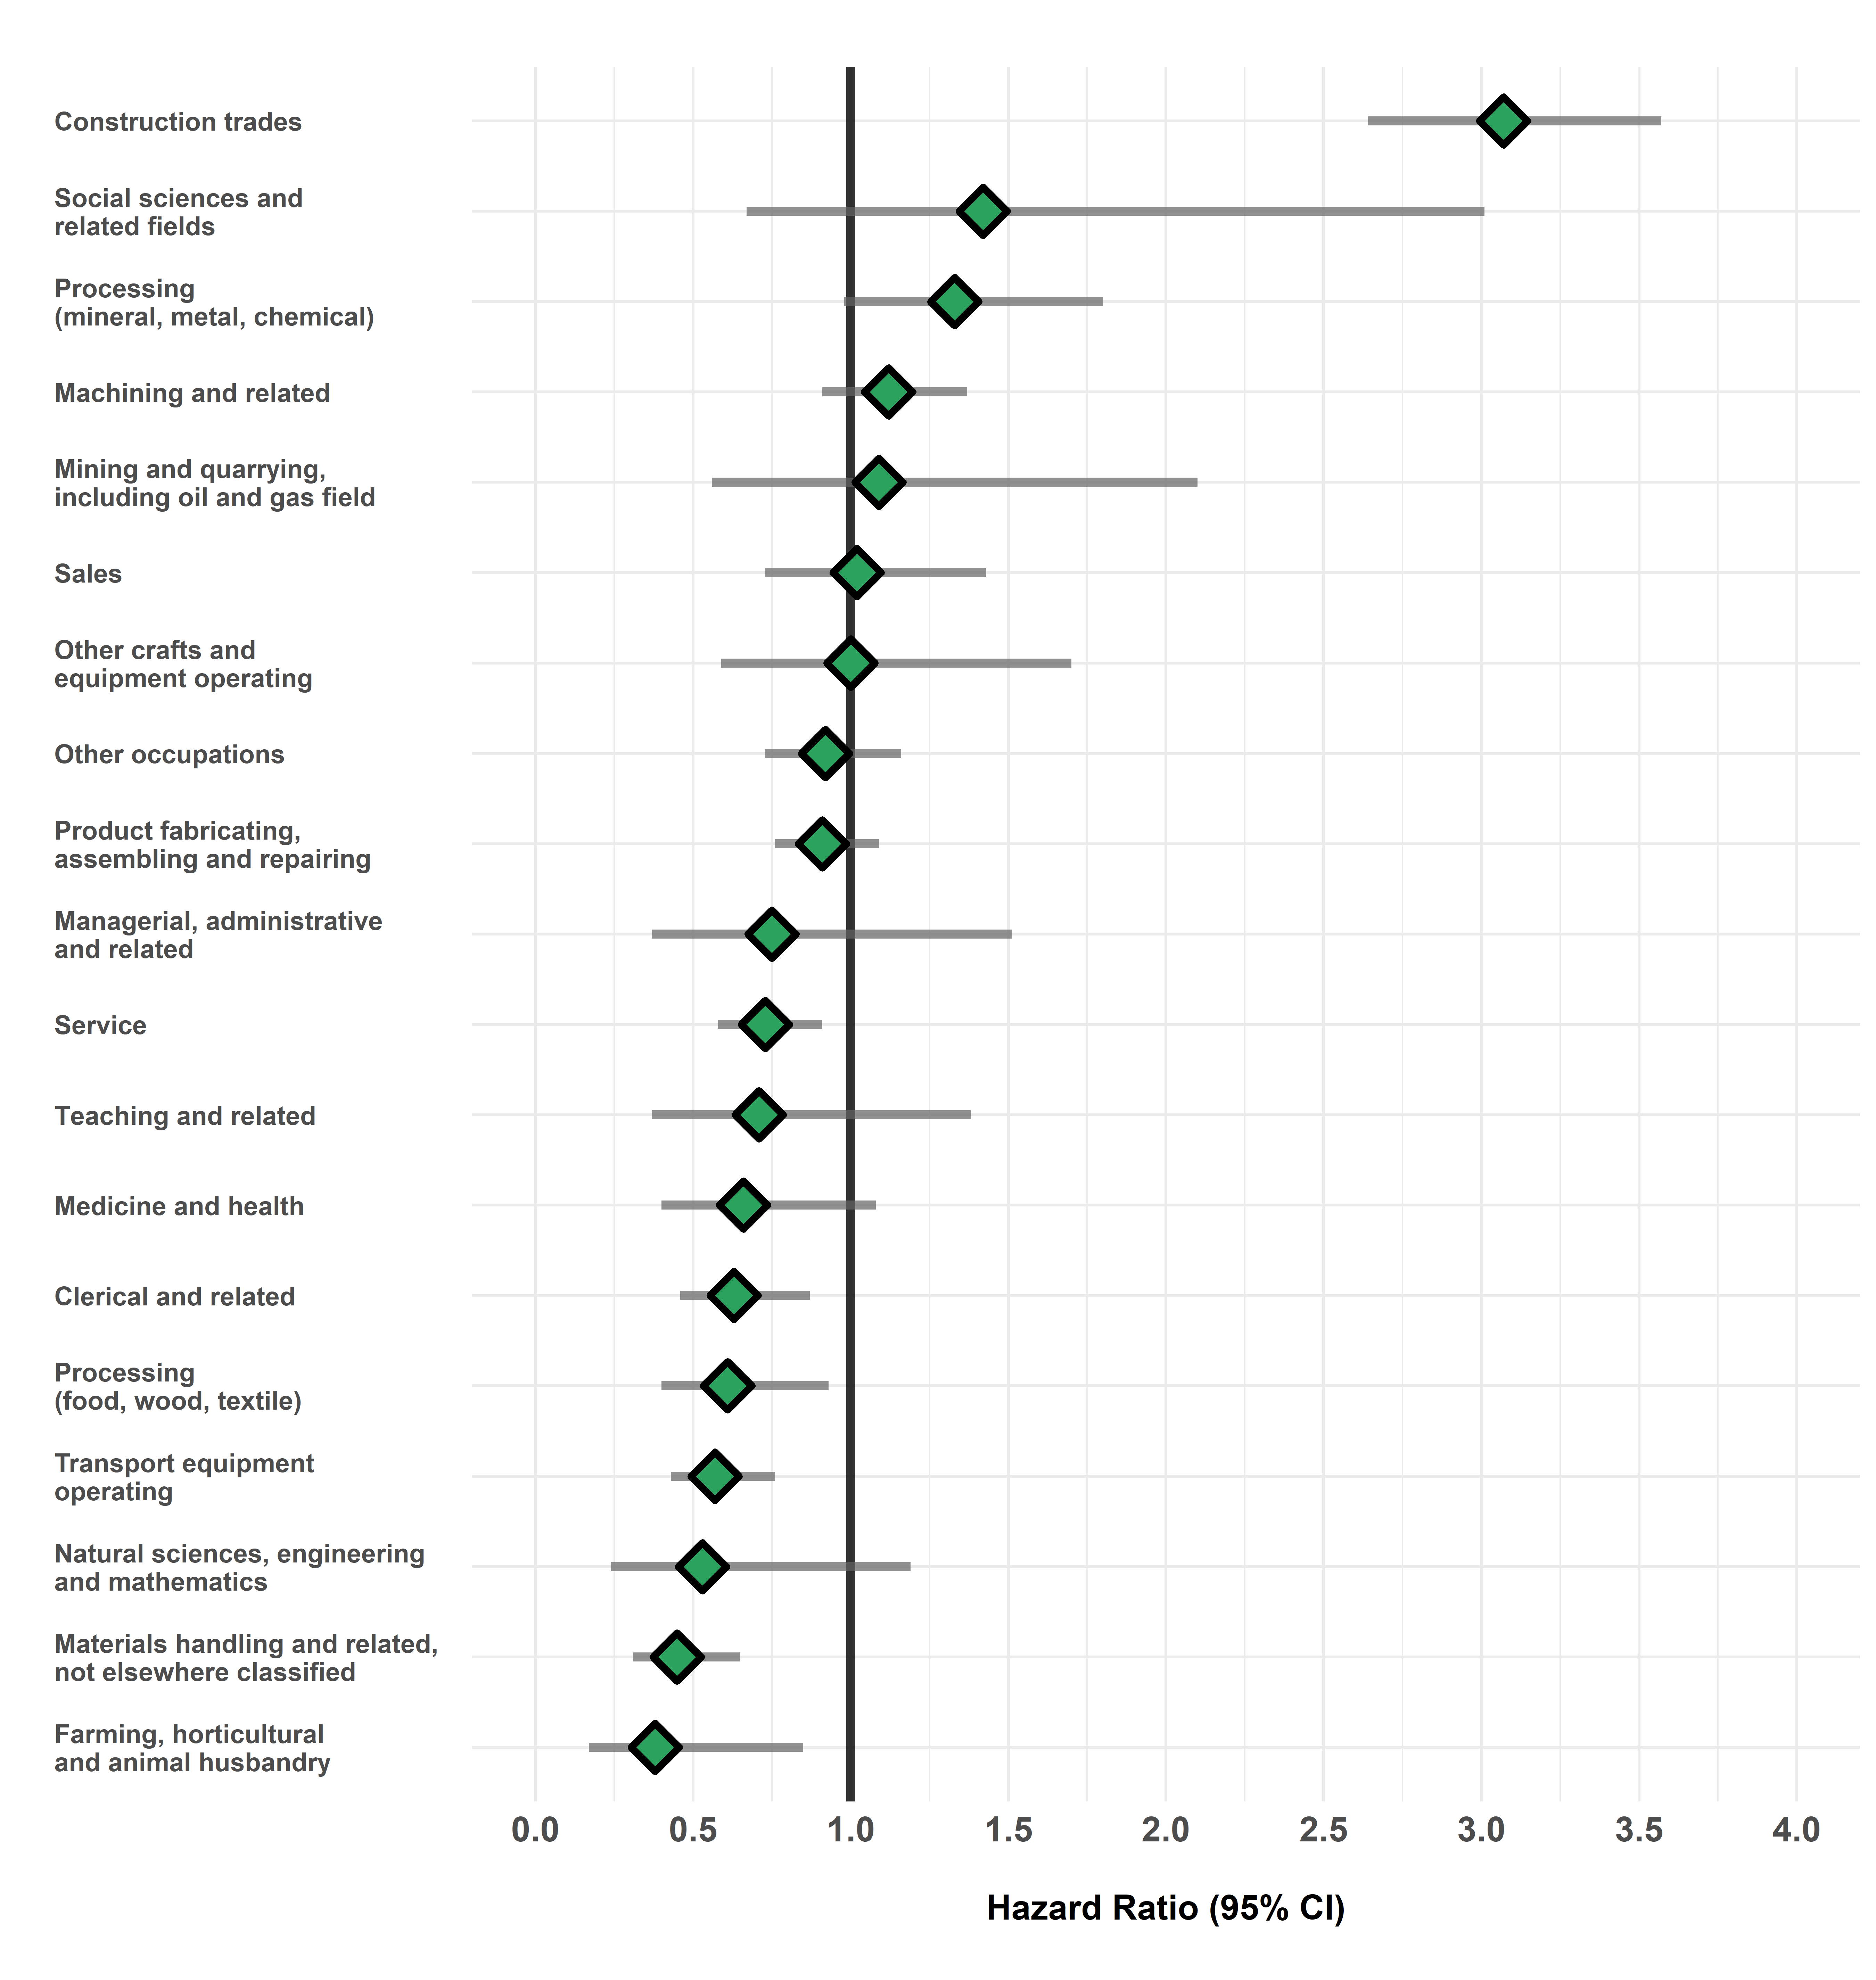
FIG2. Incidence of dermatitis diagnoses among workers employed in each occupation group relative to all others, Occupational Disease Surveillance System (ODSS), 1999-2016

The hazard ratio is an estimate of the average time to diagnosis among workers in each industry/occupation group divided by that in all others during the study period. Hazard ratios above 1.00 indicate a greater incidence of disease in a given group compared to all others. Estimates are adjusted for birth year and sex. The width of the 95% Confidence Interval (CI) is based on the number of cases in each group (more cases narrows the interval).
Table of Results
Table1. Surveillance of Dermatitis: Number of cases, workers employed, and hazard ratios in each industry (SIC)
| SIC Code * | Industry Group | Number of cases | Number of workers employed | Hazard Ratio (95% CI) † |
| 1 | Agriculture | 214 | 7,686 | 0.76 (0.67, 0.87) |
| 2/3 | Forestry, Fishing and Trapping |
33 | 1,333 | 0.72 (0.51, 1.02) |
| 4 | Mines, Quarries and Oil Wells |
80 | 2,938 | 0.81 (0.65, 1.01) |
| 5 | Manufacturing | 4,254 | 106,619 | 1.11 (1.07, 1.14) |
| 6 | Construction | 1,315 | 49,098 | 0.78 (0.74, 0.83) |
| 7 | Transportation, Communication and Other Utilities |
1,621 | 46,208 | 0.96 (0.92, 1.01) |
| 8 | Trade | 3,878 | 105,536 | 0.95 (0.92, 0.99) |
| 9 | Finance, Insurance and Real Estate |
188 | 5,194 | 0.91 (0.79, 1.05) |
| 10 | Community, Business and Personal Service |
7,311 | 170,758 | 1.02 (0.99, 1.05) |
| 11 | Public Administration and Defense |
1,821 | 45,567 | 1.00 (0.96, 1.05) |
| * SIC: Standard Industrial Classification (1970) | ||||
| † Hazard rate in each group relative to all others | ||||
Table2. Surveillance of Dermatitis: Number of cases, workers employed, and hazard ratios in each occupation (CCDO) group
| CCDO Code * | Occupation Group | Number of cases | Number of workers employed | Hazard Ratio (95% CI) † |
| 11 | Managerial, administrative and related |
498 | 11,973 | 0.98 (0.89, 1.07) |
| 21 | Natural sciences, engineering and mathematics |
283 | 7,203 | 1.06 (0.94, 1.19) |
| 23 | Social sciences and related fields |
532 | 10,389 | 1.13 (1.04, 1.23) |
| 25 | Religion | <5 | 43 | — |
| 27 | Teaching and related | 888 | 17,718 | 1.09 (1.02, 1.17) |
| 31 | Medicine and health | 1,731 | 40,325 | 0.90 (0.85, 0.94) |
| 33 | Artistic, literary, recreational and related |
241 | 5,215 | 1.17 (1.03, 1.33) |
| 41 | Clerical and related | 1,999 | 45,733 | 1.04 (0.99, 1.09) |
| 51 | Sales | 1,862 | 46,968 | 0.96 (0.92, 1.01) |
| 61 | Service | 3,852 | 91,788 | 1.03 (1.00, 1.07) |
| 71 | Farming, horticultural and animal husbandry |
350 | 11,817 | 0.81 (0.73, 0.91) |
| 73 | Fishing, hunting, trapping and related |
10 | 168 | 1.03 (0.46, 2.29) |
| 75 | Forestry and logging | 33 | 1,110 | 0.87 (0.61, 1.22) |
| 77 | Mining and quarrying, including oil and gas field |
50 | 1,818 | 0.82 (0.62, 1.09) |
| 81 | Processing (mineral, metal, chemical) |
514 | 13,255 | 1.05 (0.96, 1.14) |
| 82 | Processing (food, wood, textile) |
831 | 19,613 | 1.09 (1.02, 1.17) |
| 83 | Machining and related | 1,143 | 29,146 | 1.14 (1.07, 1.21) |
| 85 | Product fabricating, assembling and repairing |
2,075 | 53,765 | 1.08 (1.03, 1.13) |
| 87 | Construction trades | 1,318 | 47,847 | 0.81 (0.77, 0.86) |
| 91 | Transport equipment operating |
1,286 | 38,990 | 0.94 (0.89, 1.00) |
| 93 | Materials handling and related, not elsewhere classified |
890 | 24,050 | 1.04 (0.97, 1.11) |
| 95 | Other crafts and equipment operating |
154 | 3,481 | 1.20 (1.03, 1.41) |
| 99 | Other occupations not elsewhere classified | 1,263 | 34,642 | 1.01 (0.95, 1.07) |
| * CCDO: Canadian Classification Dictionary of Occupations (1971) | ||||
| † Hazard rate in each group relative to all others | ||||
 Workers in these industries are exposed to aluminum, arsenic, beryllium, cadmium, chromium, nickel compounds, silica dust, and PAHs. IARC has also classified iron and steel founding as having an increased risk of lung cancer. Boilermakers may be exposed to asbestos and moulding, coremaking and metal casting may involve exposure to crystalline silica.


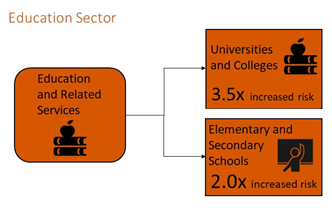 Workers within the education and related services sector include teachers and administrative staff. These workers are possibly exposed to asbestos that was installed as pipe insulation in older school and university buildings. The degradation of these buildings can lead to water damage, which can volatilize asbestos and pose a health risk to staff. ODSS results indicate that university and college staff as well as elementary and secondary school staff are at increased risks of mesothelioma. While these findings may not appear obvious given the clerical and teaching tasks of education workers, these associations have been previously observed and are supported in the scientific literature.
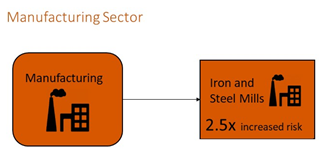 Iron and steel mill workers are required to operate machinery, including boilerplates, furnaces, and other heating apparatuses. Asbestos was commonly used as an insulating material in metalworking machinery. When these materials are disturbed or degrade asbestos fibers are released into the air. ODSS results demonstrate that iron and steel workers are at an increased risk of mesothelioma relative to other Ontario workers.