
Overview
Mesothelioma is a cancer caused by exposure to asbestos. It develops decades after exposure. It most commonly occurs in the lining of the lungs (the pleura), but can also occur in the lining of the digestive organs (the peritoneum) and at other sites in the body. Treatment options are limited and five-year survival for this disease is extremely poor. While asbestos use has decreased in Canada since the 1970s, exposure is still occurring. The recent national asbestos ban is a positive step to reduce the burden of mesothelioma in the long term, but exposure to asbestos in existing buildings and older products is an ongoing concern.
Surveillance of mesothelioma is essential for understanding this deadly disease. Past investigations by the Occupational Cancer Research Centre and data from the Ontario Cancer Registry have shown that mesothelioma incidence increased from 1981 to 2013 in Ontario and the number of cases continues to rise.
This ongoing project seeks to update our understanding of mesothelioma incidence in Ontario and Canada and to examine the changing patterns and time trends. We also aim to examine geographic and clinical determinants of mesothelioma survival in an effort to understand if we have made progress in lengthening mesothelioma survival.
Trends in Number of Mesothelioma Cases
Figure 1. Number of Mesothelioma Cases in Ontario, 1992-2017
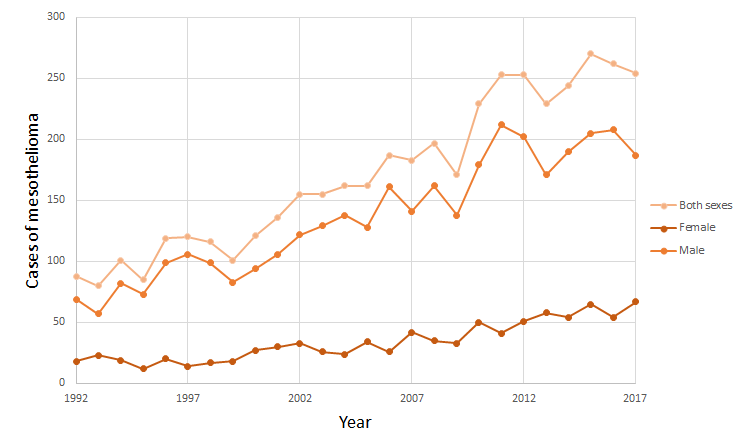
Data from the Ontario Cancer Registry, 1992-2017.
Figure 2. Number of Mesothelioma Cases by Province, 1993-2017
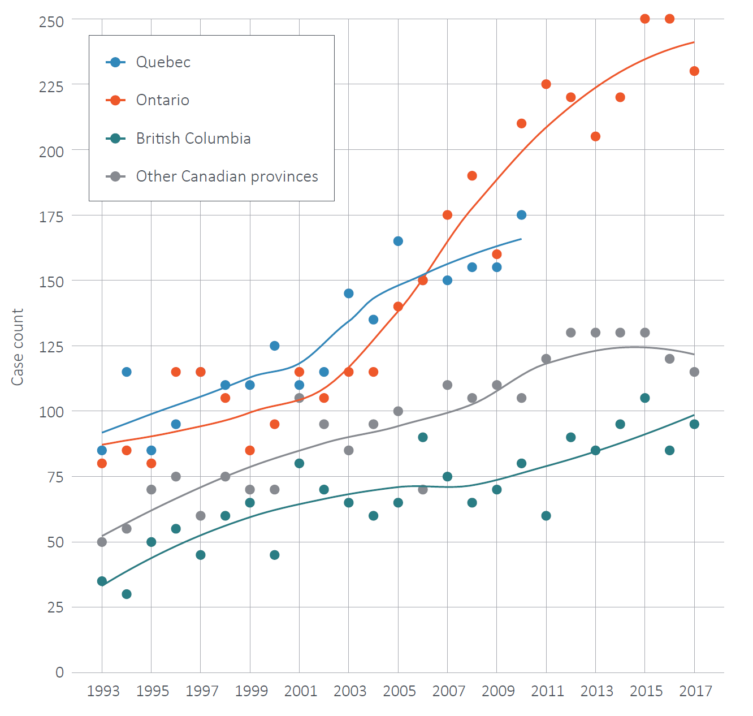
Data from the Ontario Cancer Registry and the Canadian Cancer Registry, 1993-2017.
Trends in Incidence Rates
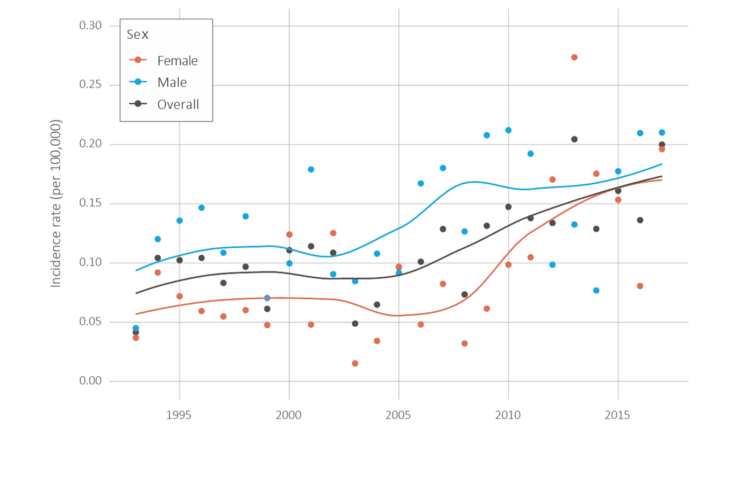
Figure 1. Mesothelioma Incidence Rates in Ontario, 1993-2017, by Sex
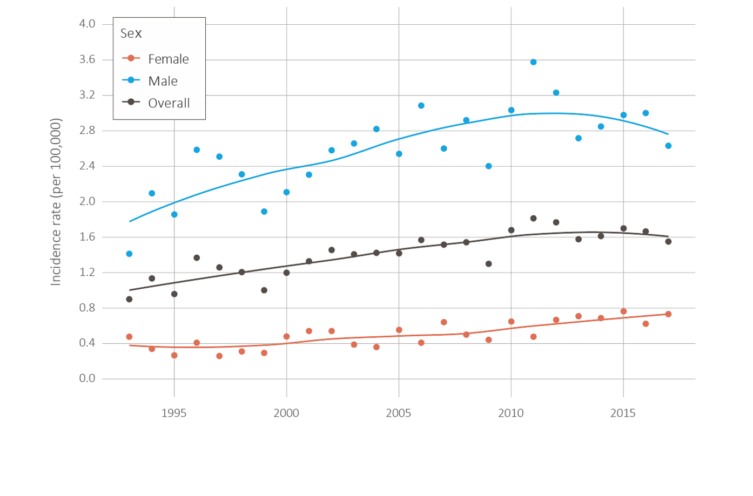
Data from the Ontario Cancer Registry, 1993-2017. Age-adjusted incidence rates shown per 100,000.
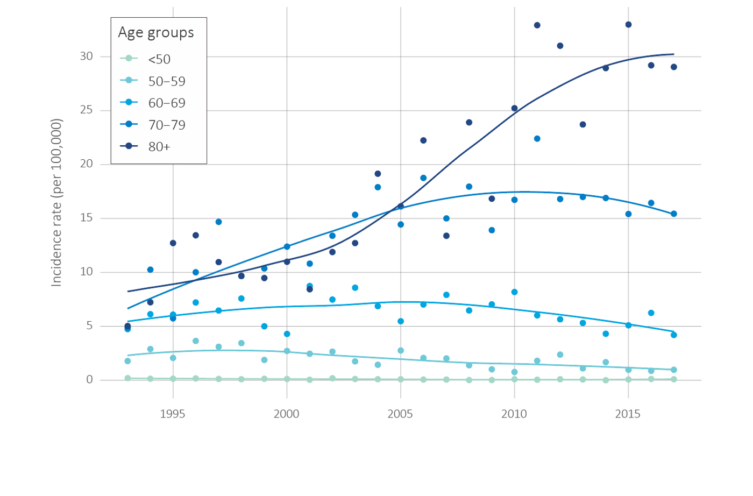
Figure 2. Pleural Mesothelioma Incidence Rates in Ontario, 1993-2017
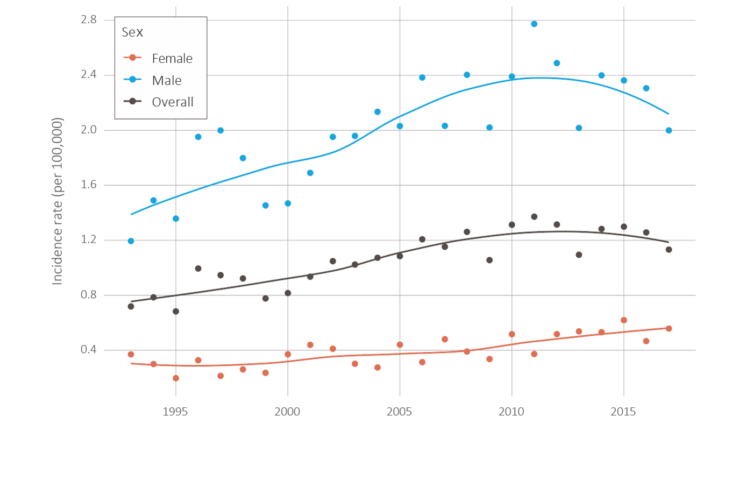
Data from the Ontario Cancer Registry, 1993-2017. Incidence rates shown per 100,000.
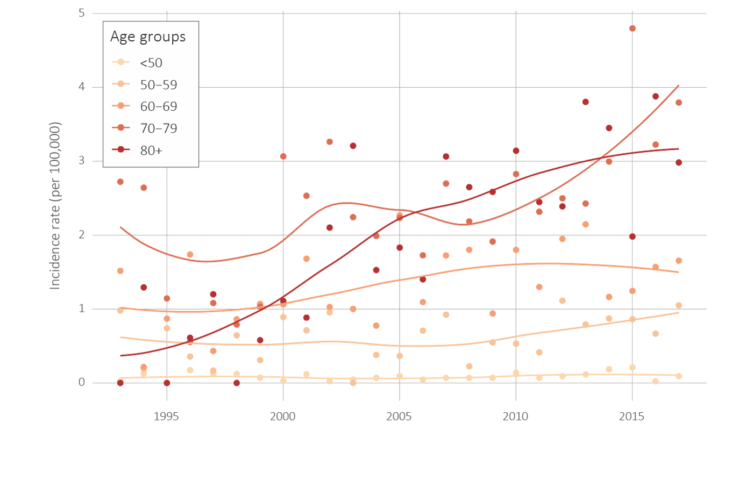
Figure 3. Peritoneal Mesothelioma Incidence Rates in Ontario, 1993-2017
Data from the Ontario Cancer Registry, 1993-2017. Incidence rates shown per 100,000.
Figure 4. Mesothelioma Incidence Rates by Age Group in Ontario, 1993-2017, Males
Data from the Ontario Cancer Registry, 1993-2017. Incidence rates shown per 100,000.
Figure 5. Mesothelioma Incidence Rates by Age Group in Ontario, 1993-2017, Females
Data from the Ontario Cancer Registry, 1993-2017. Incidence rates shown per 100,000.
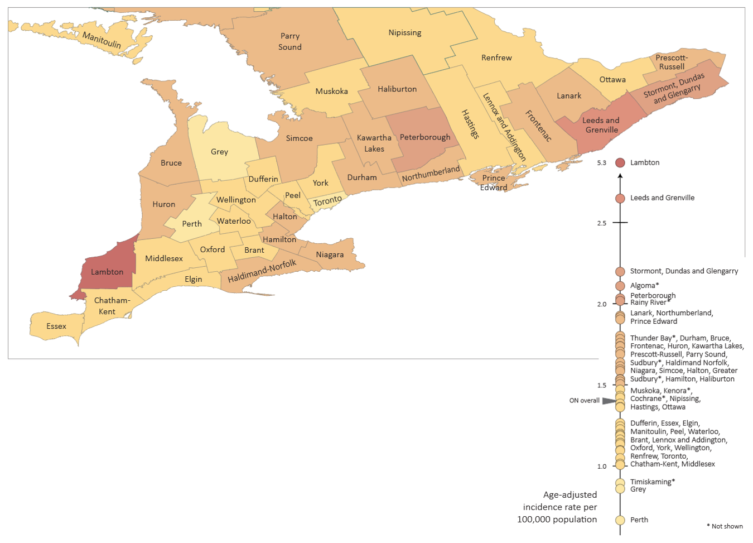
Figure 6. Mesothelioma Incidence Rates in Ontario, 1993-2017, by Census Division
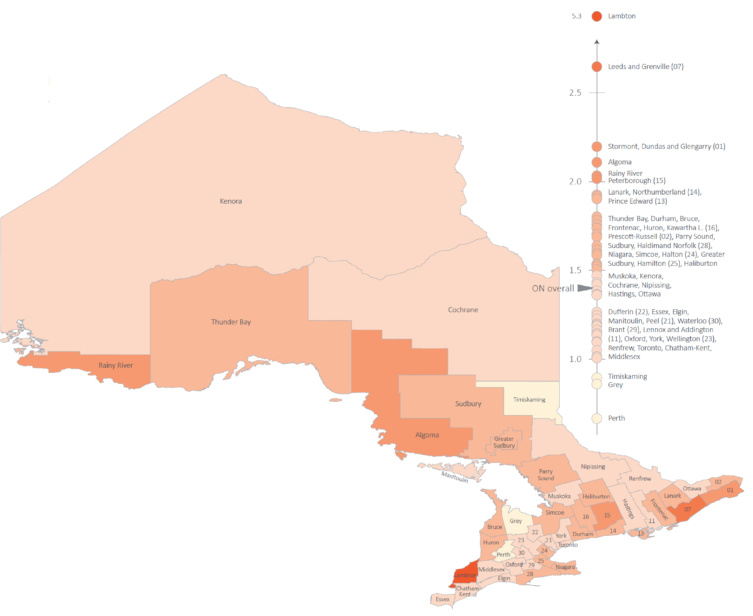
Data from the Ontario Cancer Registry, 1993-2017. Rates are shown per 100,000.
Figure 7. Mesothelioma Incidence Rates in Southern Ontario, 1992-2016, by Census Division
Data from the Ontario Cancer Registry, 1992-2016. Rates are shown per 100,000.