Non-Hodgkin Lymphoma
Background
Non-Hodgkin lymphoma (NHL) is a group of cancers of the white blood cells that perform immunological functions in the lymphatic system. NHL is the sixth most common cancer in Canada with 10,400 Canadians projected to be diagnosed in 2020 [1].
There are few established risk factors for NHL and its causes are not completely understood. Exposure to ionizing radiation through medical imaging and infection with certain viral pathogens are non-occupational risk factors for NHL, though they may also be encountered in workplaces [2,3]. Many pesticides, both organochlorine (lindane, pentachlorophenol) and organophosphorus (glyphosate, diazinon, malathion), are known or suspected causes [4–7]. Other suspected occupational risk factors for NHL include trichloroethylene, used in dry-cleaning and various industrial manufacturing processes, benzene, chlorinated solvents, and PCBs [8–10].
Known occupational risk factors
-
- Lindane (insecticide) [4]
- Pentachlorophenol (fungicide) [5]
Possible occupational risk factors
-
- Benzene [9]
- Trichloroethylene and dichloromethane (chlorinated solvents) [8]
- Glyphosate (herbicide) [6]
- Diazinon, malathion, and DDT (insecticides) [4,6,7]
- Polychlorinated biphenyls (PCBs) [10]
Key Findings
Increased risks of NHL were found among some groups in agriculture, mining, transportation, and electric utility workers. In Canada, DDT was phased out in the mid 1970s [11]. The use of PCBs has been banned since 1997 and lindane was deregistered for agricultural pest control in 2005 so excess risk observed in the ODSS cohort may reflect past exposures prior to their ban [12,13].
Agriculture and related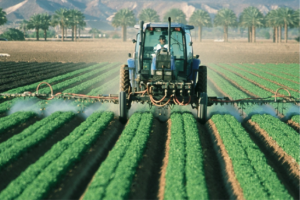
Among farming occupations, an increased risk was observed only among farmers, based on a small number of observed cases. No excess risk was observed for the more than 40 thousand farm and nursery labourers tracked in the ODSS. An excess risk was observed for workers in fertilizer manufacturing, but this was based on only a small number of NHL cases.
-
- Farmers: 1.21 times the risk
- Agriculturists and related scientists: 1.73 times the risk
- Manufacturers of mixed fertilizers: 2.68 times the risk
Mining and mineral ore treating occupations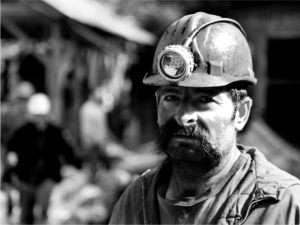
Increased risk of NHL was observed for many mining-related occupations however, the risk factors remain unclear.
-
- Metal mines: 1.44 times the risk
- Uranium mines: 1.93 times the risk
- Miscellaneous metal mines: 1.39 times the risk
- Gold quartz mines: 1.30 times the risk
- Quarries and sand pits: 1.20 times the risk
- Non-metal mines: 1.18 times the risk
- Mineral ore treating occupations: 2.24 times the risk
- Crushing and grinding occupations: 2.50 times the risk
- Metal mines: 1.44 times the risk
Transportation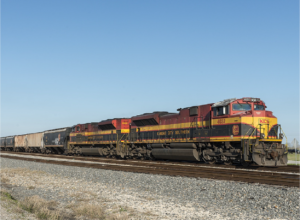
Workers in transportation-related occupations are regularly exposed to engine exhaust fumes, which contain benzene [9].
-
- Motor transport operators: 1.14 times the risk
- Taxi drivers: 1.53 times the risk
- Bus drivers: 1.25 times the risk
- Truck drivers: 1.12 times the risk
- Railway transport operators: 1.37 times the risk
- Conductors and brakemen: 1.67 times the risk
- Motor transport operators: 1.14 times the risk
Electric utility workers
Increased risk of NHL has been previously observed among electric utility workers in Ontario [14]. While PCBs have been banned in Canada, they may remain in existing electrical equipment [13].
-
- Electric power industry: 1.17 times the risk
- Electrical power linemen and related: 1.60 times the risk
- Wire communications and related equipment installing and repairing: 1.18 times the risk
Other
Increased risks were observed for several additional groups, but were inconsistent, making it difficult to draw conclusions regarding potential NHL-related exposures.
Increased risk of NHL among firefighters may be linked to exposure to benzene, polychlorinated biphenyls (PCBs) and other chemicals during firefighting [3,10].
-
- Firefighting occupations: 1.42 times the risk
An increased risk was observed for foremen mechanics and repairmen (except electrical), but no excess risk was observed among mechanics more broadly. Similarly, foremen in metal machining occupations and electrical equipment assembly and repair had increased risk, but no excess was observed for other workers in these occupations. Longer durations of employment and exposure to NHL carcinogens among foremen compared to other workers may explain some of this difference in risk.
-
- Mechanics and repairmen, except electrical (foremen): 1.74 times the risk
- Metal machining occupations (foremen): 1.71 times the risk
An excess risk was observed among radiological technologists and technicians, but only a small number of cases were observed for this group. Exposure to ionizing radiation through medical imagining is a risk factor for NHL, but this has not been established as a risk factor through work-related exposure [15].
-
- Radiological technologists and technicians: 1.44 times the risk
Relative Risk by Industry and Occupation
Figure 1. Risk of NHL diagnosis among workers employed in each industry group relative to all others, Occupational Disease Surveillance System (ODSS), 1999-2016
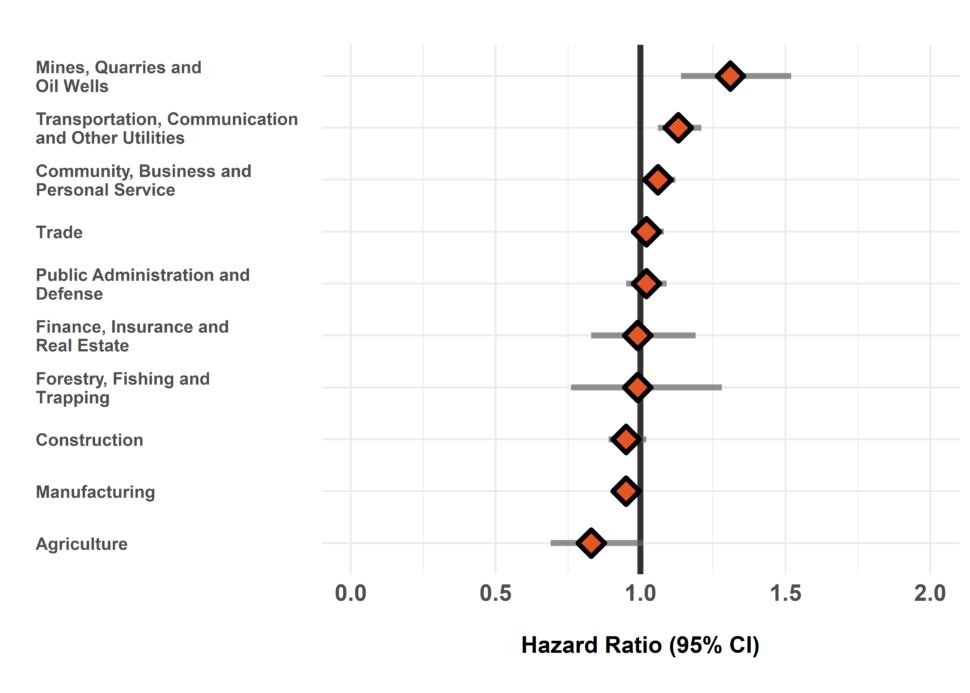
The hazard ratio is an estimate of the average time to diagnosis among workers in each industry/occupation group divided by that in all others during the study period. Hazard ratios above 1.00 indicate a greater risk of disease in a given group compared to all others. Estimates are adjusted for birth year and sex. The width of the 95% Confidence Interval (CI) is based on the number of cases in each group (more cases narrows the interval).
Figure 2. Risk of NHL diagnosis among workers employed in each occupation group relative to all others, Occupational Disease Surveillance System (ODSS), 1999-2016
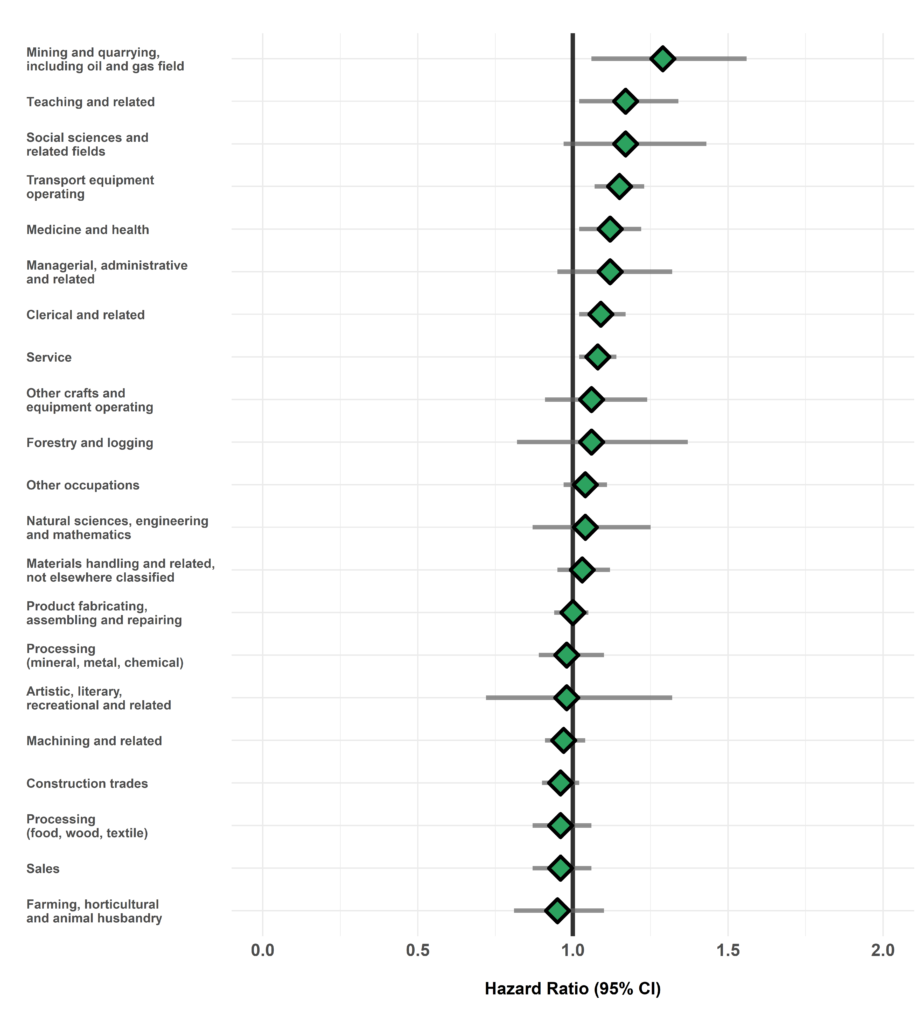
The hazard ratio is an estimate of the average time to diagnosis among workers in each industry/occupation group divided by that in all others during the study period. Hazard ratios above 1.00 indicate a greater risk of disease in a given group compared to all others. Estimates are adjusted for birth year and sex. The width of the 95% Confidence Interval (CI) is based on the number of cases in each group (more cases narrows the interval).
Table of Results
Table 1. Surveillance of NHL: Number of cases, workers employed, and hazard ratios in each industry (SIC)
| SIC Code * | Industry Group | Number of cases | Number of workers employed | Hazard Ratio (95% CI) † |
| 1 | Agriculture | 107 | 35,003 | 0.83 (0.69-1.01) |
| 2/3 | Forestry, Fishing and Trapping |
57 | 10,697 | 0.99 (0.76-1.28) |
| 4 | Mines, Quarries and Oil Wells |
192 | 23,197 | 1.31 (1.14-1.52) |
| 5 | Manufacturing | 3,387 | 693,452 | 0.95 (0.91-0.99) |
| 6 | Construction | 918 | 210,935 | 0.95 (0.89-1.02) |
| 7 | Transportation, Communication and Other Utilities |
1035 | 197,140 | 1.13 (1.06-1.21) |
| 8 | Trade | 1,655 | 429,166 | 1.02 (0.97-1.08) |
| 9 | Finance, Insurance and Real Estate |
119 | 23,980 | 0.99 (0.83-1.19) |
| 10 | Community, Business and Personal Service |
2,347 | 599,427 | 1.06 (1.01-1.12) |
| 11 | Public Administration and Defense |
943 | 190,812 | 1.02 (0.95-1.09) |
| * SIC: Standard Industrial Classification (1970) | ||||
| † Hazard rate in each group relative to all others | ||||
Table 2. Surveillance of NHL: Number of cases, workers employed, and hazard ratios in each occupation (CCDO) group
| CCDO Code * | Occupation Group | Number of cases | Number of workers employed | Hazard Ratio (95% CI) † |
| 11 | Managerial, administrative and related |
140 | 30,975 | 1.12 (0.95-1.32) |
| 21 | Natural sciences, engineering and mathematics |
119 | 26,331 | 1.04 (0.87-1.25) |
| 23 | Social sciences and related fields |
104 | 30,700 | 1.17 (0.97-1.43) |
| 25 | Religion | <5 | 128 | – |
| 27 | Teaching and related | 219 | 48,457 | 1.17 (1.02-1.34) |
| 31 | Medicine and health | 551 | 135,319 | 1.12 (1.02-1.22) |
| 33 | Artistic, literary, recreational and related |
43 | 14,993 | 0.98 (0.72-1.32) |
| 41 | Clerical and related | 871 | 197,275 | 1.09 (1.02-1.17) |
| 51 | Sales | 464 | 148,074 | 0.96 (0.87-1.06) |
| 61 | Service | 1,616 | 370,781 | 1.08 (1.02-1.14) |
| 71 | Farming, horticultural and animal husbandry |
171 | 50,137 | 0.95 (0.81-1.10) |
| 73 | Fishing, hunting, trapping and related |
<5 | 556 | – |
| 75 | Forestry and logging | 58 | 10,681 | 1.06 (0.82-1.37) |
| 77 | Mining and quarrying, including oil and gas field |
103 | 13,036 | 1.29 (1.06-1.56) |
| 81 | Processing (mineral, metal, chemical) |
353 | 79,210 | 0.98 (0.89-1.10) |
| 82 | Processing (food, wood, textile) |
411 | 99,234 | 0.96 (0.87-1.06) |
| 83 | Machining and related | 933 | 189,387 | 0.97 (0.91-1.04) |
| 85 | Product fabricating, assembling and repairing |
1,644 | 328,243 | 1.00 (0.94-1.05) |
| 87 | Construction trades | 1,037 | 215,539 | 0.96 (0.90-1.02) |
| 91 | Transport equipment operating |
928 | 168,028 | 1.15 (1.07-1.23) |
| 93 | Materials handling and related, not elsewhere classified |
685 | 153,024 | 1.03 (0.95-1.12) |
| 95 | Other crafts and equipment operating |
156 | 28,304 | 1.06 (0.91-1.24) |
| 99 | Other occupations not elsewhere classified | 954 | 215,218 | 1.04 (0.97-1.11) |
| * CCDO: Canadian Classification Dictionary of Occupations (1971) | ||||
| † Hazard rate in each group relative to all others | ||||
Please note that ODSS results shown here may differ from those previously published or presented. This may occur due to changes in case definitions, methodological approaches, and the ongoing nature of the surveillance cohort.
References
- Brenner DR, Weir HK, Demers AA, Ellison LF, Louzado C, Shaw A, et al. Projected estimates of cancer in Canada in 2020. Can Med Assoc J [Internet]. 2020;192(9):E199–205.
- IARC Working Group. A Review of Human Carcinogens- Radiation. Vol. 100D. Lyon, France: International Agency for Research on Cancer (IARC); 2012.
- McGregor D. Risk of Non-Hodgkin Lymphoma in Firemen. Montreal, Quebec; 2007.
- IARC Working Group. IARC Monographs on the Evaluation of Carcinogenic Risks to Humans- DDT, Lindane, and 2,4-D. Vol. 113. Lyon, France: International Agency for Research on Cancer (IARC); 2018.
- IARC Working Group. IARC Monographs on the Evaluation of Carcinogenic Risks to Humans- Pentachlorophenol and Some Related Compounds To Humans. Vol. 117. Lyon, France: International Agency for Research on Cancer (IARC); 2019.
- IARC Working Group. IARC Monographs on the Evaluation of Carcinogenic Risks to Humans- Some organophosphate insecticides and herbicides. Vol. 112. Lyon, France: International Agency for Research on Cancer (IARC); 2017.
- Luo D, Zhou T, Tao Y, Feng Y, Shen X, Mei S. Exposure to organochlorine pesticides and non-Hodgkin lymphoma: A meta-analysis of observational studies. Sci Rep. 2016;6(January):1–11.
- IARC Working Group. IARC monographs on the evaluation of carcinogenic risks to humans-Trichloroethylene, Tetrachloroethylene, and Some Other Chlorinated Agents. Vol. 106. Lyon: International Agency for Research on Cancer (IARC); 2014.
- IARC Working Group. A Review of Human Carcinogens- Chemical agents and related occupations. Vol. 100F. Lyon, France: International Agency for Research on Cancer (IARC); 2012.
- IARC Working Group. IARC Monographs on the Evaluation of Carcinogenic Risks to Humans- Polychlorinated Biphenyls and Polybrominated Biphenyls. Vol. 107. Lyon, France: International Agency for Research on Cancer (IARC); 2016.
- Dichlorodiphenyltrichloroethane – Management of Toxic Substances. [cited 2020 Aug 28].
- Environment and Climate Change Canada – Acts & Regulations – Update to Canada’s National Implementation Plan under the Stockholm Convention on Persistent Organic Pollutants. [cited 2020 Aug 28].
- Toxic substances list: PCBs. [cited 2020 Aug 28].
- Villeneuve PJ, Agnew DA, Miller AB, Corey PN. Non-Hodgkin’s lymphoma among electric utility workers in Ontario: The evaluation of alternate indices of exposure to 60 Hz electric and magnetic fields. Occup Environ Med. 2000;57(4):249–57.
- Karipidis KK, Benke G, Sim MR, Kauppinen T, Kricker A, Hughes AM, et al. Occupational exposure to ionizing and non-ionizing radiation and risk of non-Hodgkin lymphoma. Int Arch Occup Environ Health. 2007;80(8):663–70.