Mesothelioma
Background
Mesothelioma is a cancer of the tissue lining the lungs and other organs caused by exposure to inhaled asbestos fibres. It is characterized by a long latency period: the onset of disease can be as much as 50 years after exposure to asbestos fibres. There is no cure and survival is extremely poor.
Risk factors
-
- Asbestos fibres [1]
Asbestos is the commercial name for a group of naturally occurring mineral fibres. It was historically used in many commercial applications including insulation, roofing, cement pipe and sheets, gaskets, and friction materials. Use of asbestos was banned in Canada in 2018, although it is still found in many older products and buildings. The Burden of Occupational Cancer in Canada Study estimates that approximately 80% of mesothelioma cases are attributable to occupational asbestos exposure.
Key Findings
The greatest risks of mesothelioma were observed among workers employed in construction, asbestos mining, and some metal industries and occupations. Mesothelioma typically develops a minimum of 20 to 40 years after asbestos exposure [2], so diagnoses among ODSS cohort workers may be related to occupational asbestos exposure many years prior. However, although asbestos is now banned in Canada [3], workers may still be exposed particularly through work in construction and renovation of older asbestos-containing buildings.
Construction
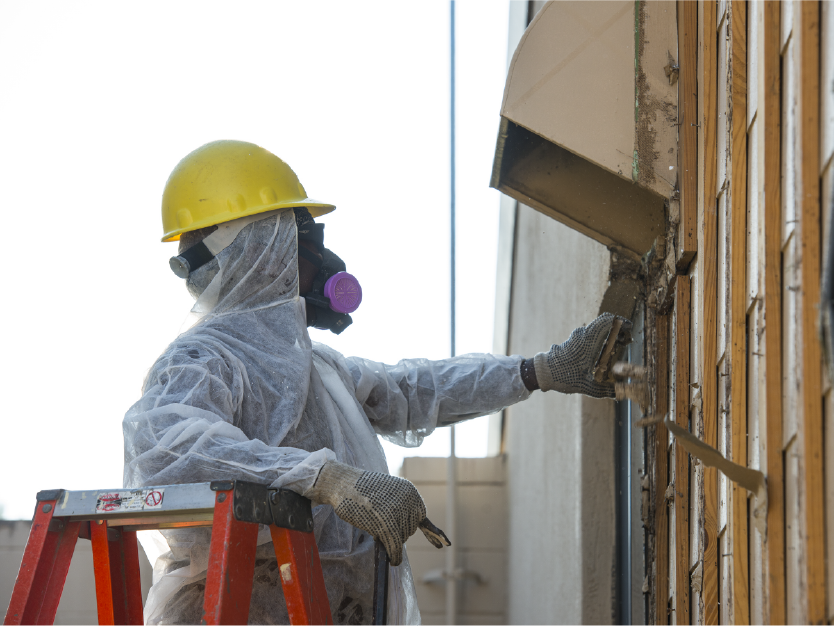 Within the construction industry, insulators and pipefitters and plumbers have the highest risks of exposure to asbestos and mesothelioma as a result of the widespread use of asbestos in insulation and pipes in buildings built prior to 1980 [4, 5]. Many other trades are also at increased risks of mesothelioma through handling asbestos-containing materials or working in an environment with those material during renovation, maintenance or demolition of older buildings.
-
- All construction trades occupations: 2.31 times the risk
- Insulating occupations: 26.6 times the risk
- Pipefitting, plumbing and related occupations: 5.55 times the risk
- Plasterers and related occupations: 2.31 times the risk
- Electricians and repairers: 2.15 times the risk
- Painters and paperhangers: 1.99 times the risk
- Brick and stone masons and tile setters: 1.84 times the risk
- Carpenters and related occupations: 1.68 times the risk
- All construction trades occupations: 2.31 times the risk
Asbestos mining
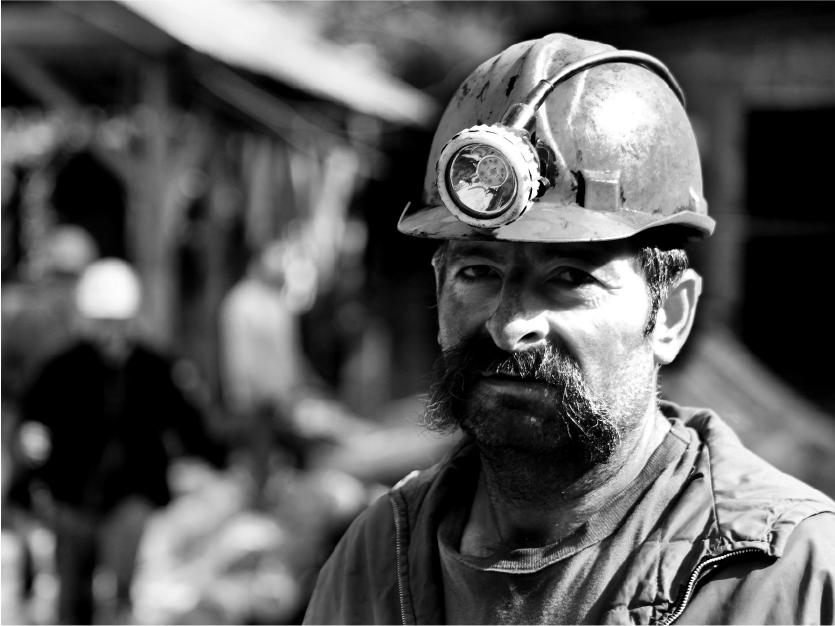 Unlike Quebec where asbestos mining was a large industry, Ontario’s asbestos mining was much smaller and only operated until 1978 [6, 7]. Nevertheless, ODSS results demonstrate that asbestos miners in Ontario are at a dramatically increased risk of mesothelioma. This an expected finding given the extraordinarily high levels of exposure likely to have occurred among asbestos miners.
-
- Asbestos mines: 224 times the risk
Metal-related industries and occupations
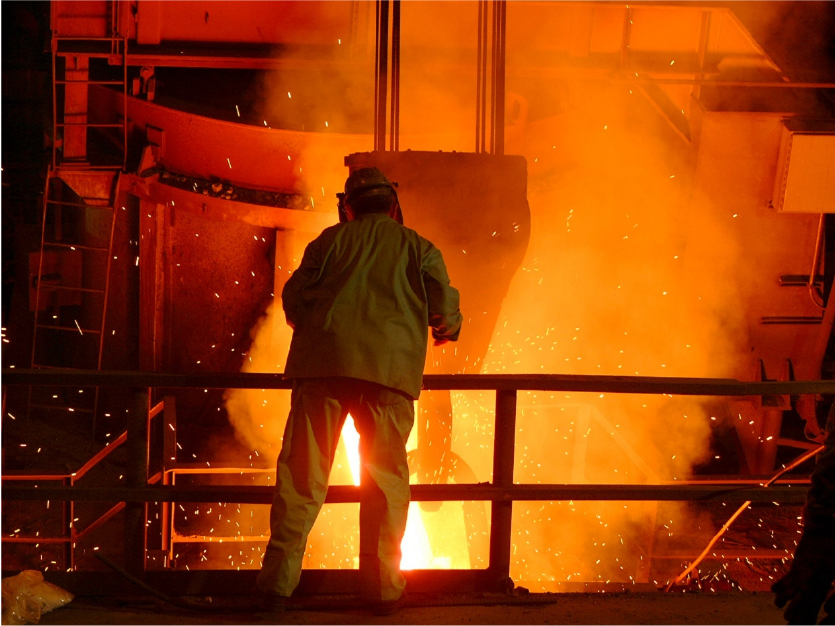 Asbestos was commonly used as an insulating material in some hot metalworking processes [8]. Primary metal industry workers may operate furnaces and other heating apparatuses insulated with asbestos.
-
- Boilermakers, platers, and structural metal workers: 3.33 times the risk
- Moulding, coremaking and metal casting occupations: 1.95 times the risk
- Welding and flame cutting occupations: 1.66 times the risk
- Iron foundries: 2.42 times the risk
- Iron and steel mills: 1.77 times the risk
Mechanics
Brake and clutch components have contained asbestos for many decades [9], and workers involved in vehicle repair and maintenance were observed to have increased risk of mesothelioma in the ODSS. Many vehicles have asbestos-containing materials, and exposure from repair of these vehicles may continue to put these workers at risk for decades.
-
- Mechanics and repairers except electrical: 1.31 times the risk
- Industrial, farm and construction machinery mechanics and repairers: 1.65 times the risk
- Motor vehicle mechanics and repairers: 1.23 times the risk
- Mechanics and repairers except electrical: 1.31 times the risk
Relative Risk by Industry and Occupation
Figure 1. Risk of mesothelioma diagnosis among workers employed in each industry group relative to all others, Occupational Disease Surveillance System (ODSS), 1983-2016
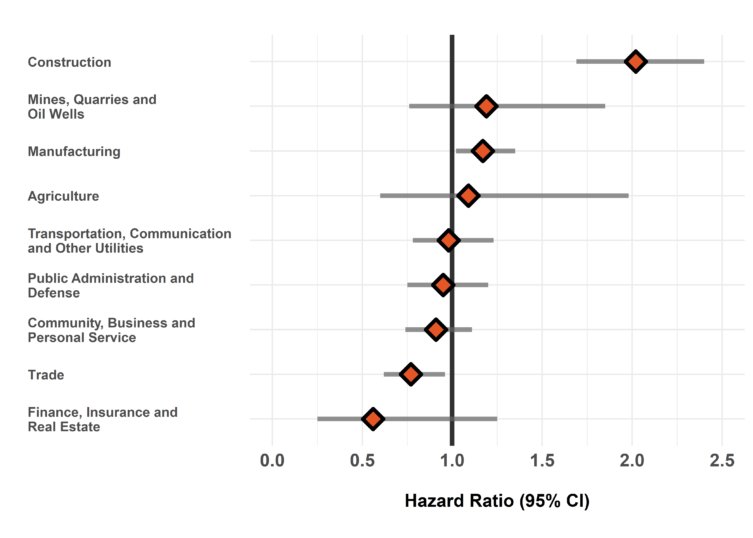
The hazard ratio is an estimate of the average time to diagnosis among workers in each industry/occupation group divided by that in all others during the study period. Hazard ratios above 1.00 indicate a greater risk of disease in a given group compared to all others. Estimates are adjusted for birth year and sex. The width of the 95% Confidence Interval (CI) is based on the number of cases in each group (more cases narrows the interval).
Figure 2. Risk of mesothelioma diagnosis among workers employed in each occupation group relative to all others, Occupational Disease Surveillance System (ODSS), 1983-2016
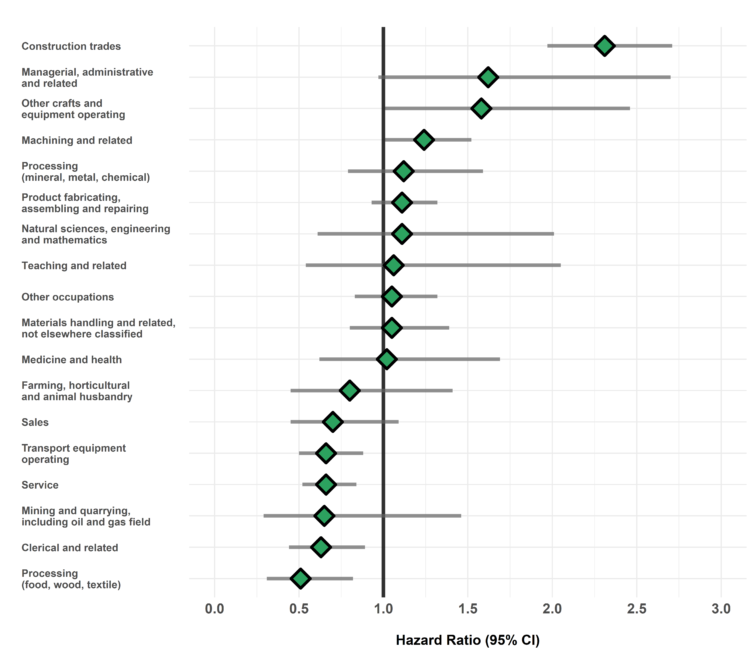
The hazard ratio is an estimate of the average time to diagnosis among workers in each industry/occupation group divided by that in all others during the study period. Hazard ratios above 1.00 indicate a greater risk of disease in a given group compared to all others. Estimates are adjusted for birth year and sex. The width of the 95% Confidence Interval (CI) is based on the number of cases in each group (more cases narrows the interval).
Table of Results
Table 1. Surveillance of Mesothelioma: Number of cases, workers employed, and hazard ratios in each industry (SIC)
| SIC Code * | Industry Group | Number of cases | Number of workers employed | Hazard Ratio (95% CI) † |
| 1 | Agriculture | 11 | 35,015 | 1.09 (0.60-1.98) |
| 2/3 | Forestry, Fishing and Trapping | <5 | 10,700 | — |
| 4 | Mines, Quarries and Oil Wells | 20 | 23,206 | 1.19 (0.76-1.85) |
| 5 | Manufacturing | 330 | 693,658 | 1.17 (1.02-1.35) |
| 6 | Construction | 164 | 210,997 | 2.02 (1.69-2.40) |
| 7 | Transportation, Communication and Other Utilities | 83 | 197,245 | 0.98 (0.78-1.23) |
| 8 | Trade | 92 | 429,314 | 0.77 (0.62-0.96) |
| 9 | Finance, Insurance and Real Estate | 6 | 23,990 | 0.56 (0.25-1.25) |
| 10 | Community, Business and Personal Service | 121 | 599,702 | 0.91 (0.74-1.11) |
| 11 | Public Administration and Defense | 76 | 190,917 | 0.95 (0.75-1.20) |
| * SIC: Standard Industrial Classification (1970) | ||||
| † Hazard ratio in each group relative to all others | ||||
Table 2. Surveillance of Mesothelioma: Number of cases, workers employed, and hazard ratios in each occupation (CCDO) group
| CCDO Code * | Occupation Group | Number of cases | Number of workers employed | Hazard Ratio (95% CI) † |
| 11 | Managerial, administrative and related | 15 | 31,006 | 1.62 (0.97-2.70) |
| 21 | Natural sciences, engineering and mathematics | 11 | 26,348 | 1.11 (0.61-2.01) |
| 23 | Social sciences and related fields | <5 | 30,717 | — |
| 25 | Religion | 0 | 128 | — |
| 27 | Teaching and related | 9 | 48,492 | 1.06 (0.54-2.05) |
| 31 | Medicine and health | 17 | 135,376 | 1.02 (0.62-1.69) |
| 33 | Artistic, literary, recreational and related | <5 | 14,998 | — |
| 41 | Clerical and related | 32 | 197,375 | 0.63 (0.44-0.89) |
| 51 | Sales | 20 | 148,146 | 0.70 (0.45-1.09) |
| 61 | Service | 75 | 370,945 | 0.66 (0.52-0.84) |
| 71 | Farming, horticultural and animal husbandry | 12 | 50,152 | 0.80 (0.45-1.41) |
| 73 | Fishing, hunting, trapping and related | 0 | 558 | — |
| 75 | Forestry and logging | <5 | 10,684 | — |
| 77 | Mining and quarrying, including oil and gas field | 6 | 13,044 | 0.65 (0.29-1.46) |
| 81 | Processing (mineral, metal, chemical) | 33 | 79,241 | 1.12 (0.79-1.59) |
| 82 | Processing (food, wood, textile) | 17 | 99,257 | 0.51 (0.31-0.82) |
| 83 | Machining and related | 106 | 189,443 | 1.24 (1.01-1.52) |
| 85 | Product fabricating, assembling and repairing | 153 | 328,355 | 1.11 (0.93-1.32) |
| 87 | Construction trades | 210 | 215,613 | 2.31 (1.97-2.71) |
| 91 | Transport equipment operating | 54 | 168,140 | 0.66 (0.50-0.88) |
| 93 | Materials handling and related, not elsewhere classified | 55 | 153,068 | 1.05 (0.80-1.39) |
| 95 | Other crafts and equipment operating | 20 | 28,306 | 1.58 (1.01-2.46) |
| 99 | Other occupations not elsewhere classified | 82 | 215,282 | 1.05 (0.83-1.32) |
| * CCDO: Canadian Classification Dictionary of Occupations (1971) | ||||
| † Hazard ratio in each group relative to all others | ||||
Time Trends
Figure 1. Crude incidence rate of mesothelioma among males in the ODSS, 1985-2014 (n=2.18 million)
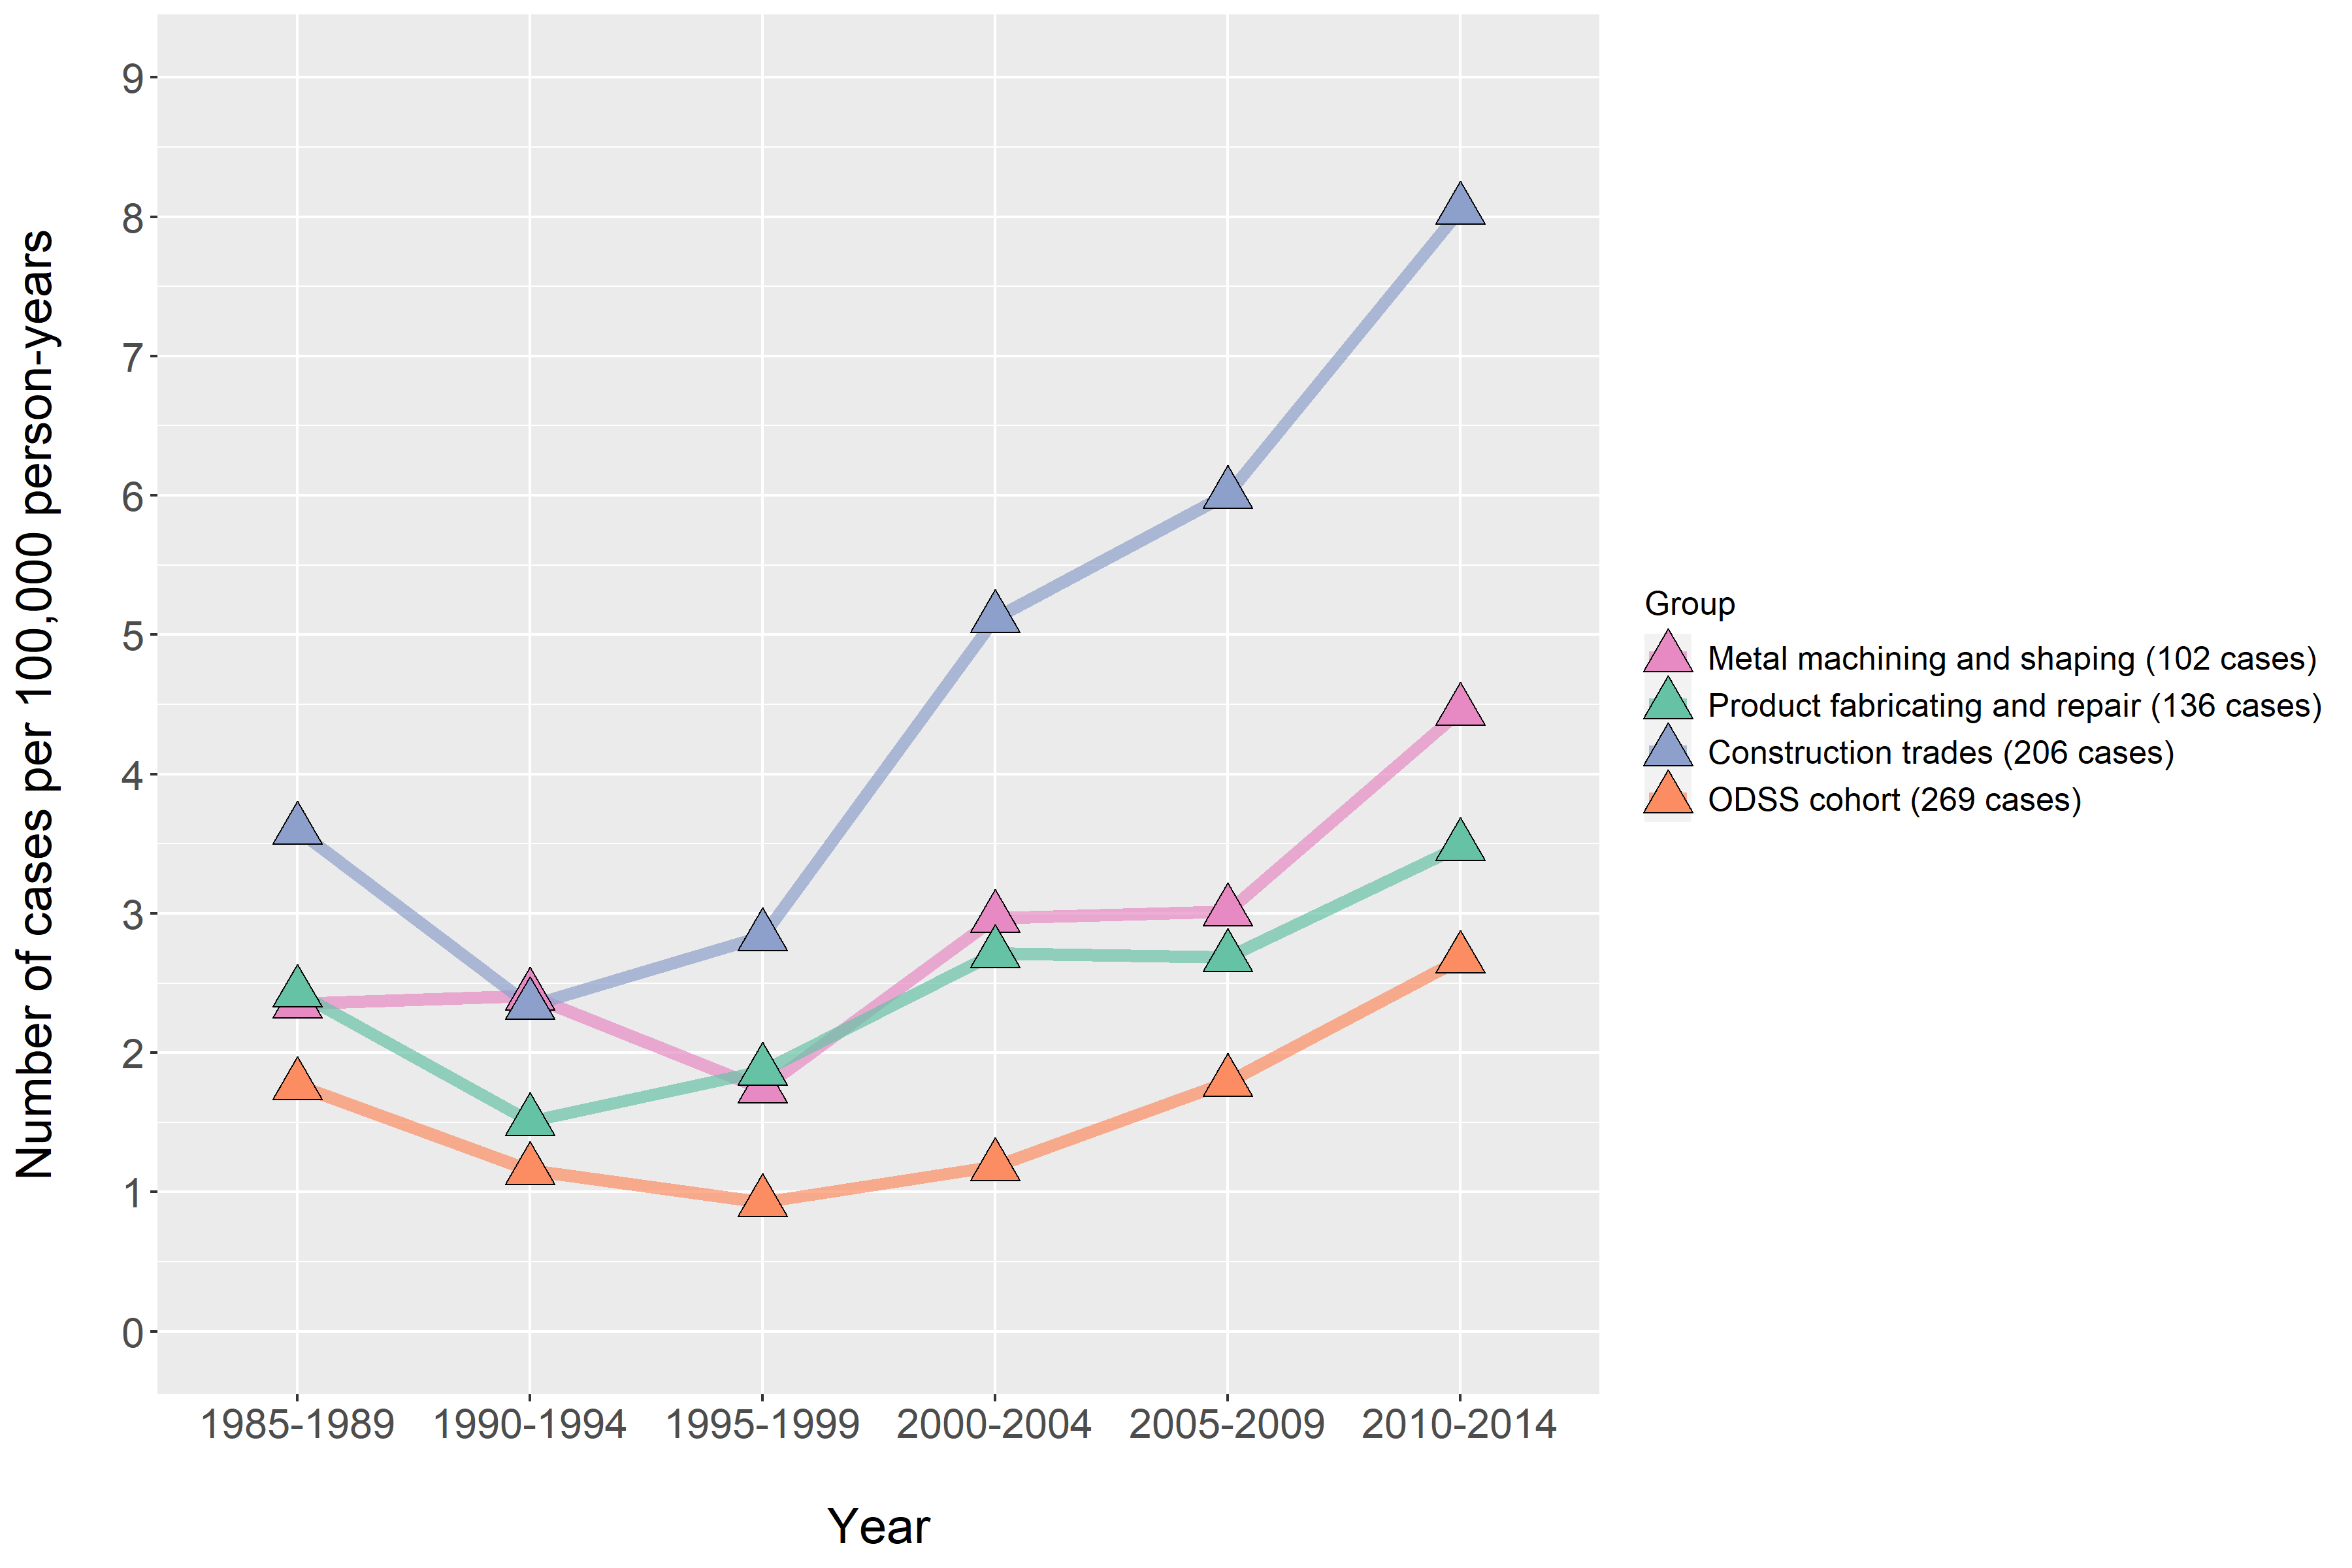
The crude incidence rate is the number of cases of disease diagnosed per person per year of follow-up in the ODSS cohort. The age-standardized incidence rate is the rate we would observe if we removed the influence of aging in the cohort over time. The general population of males in Ontario in 1995 was used as the standard. All rates are expressed per 100,000 persons per year.
Figure 2. Age-standardized incidence rate of mesothelioma among males in the ODSS, 1995-2014 (n=2.18 million)
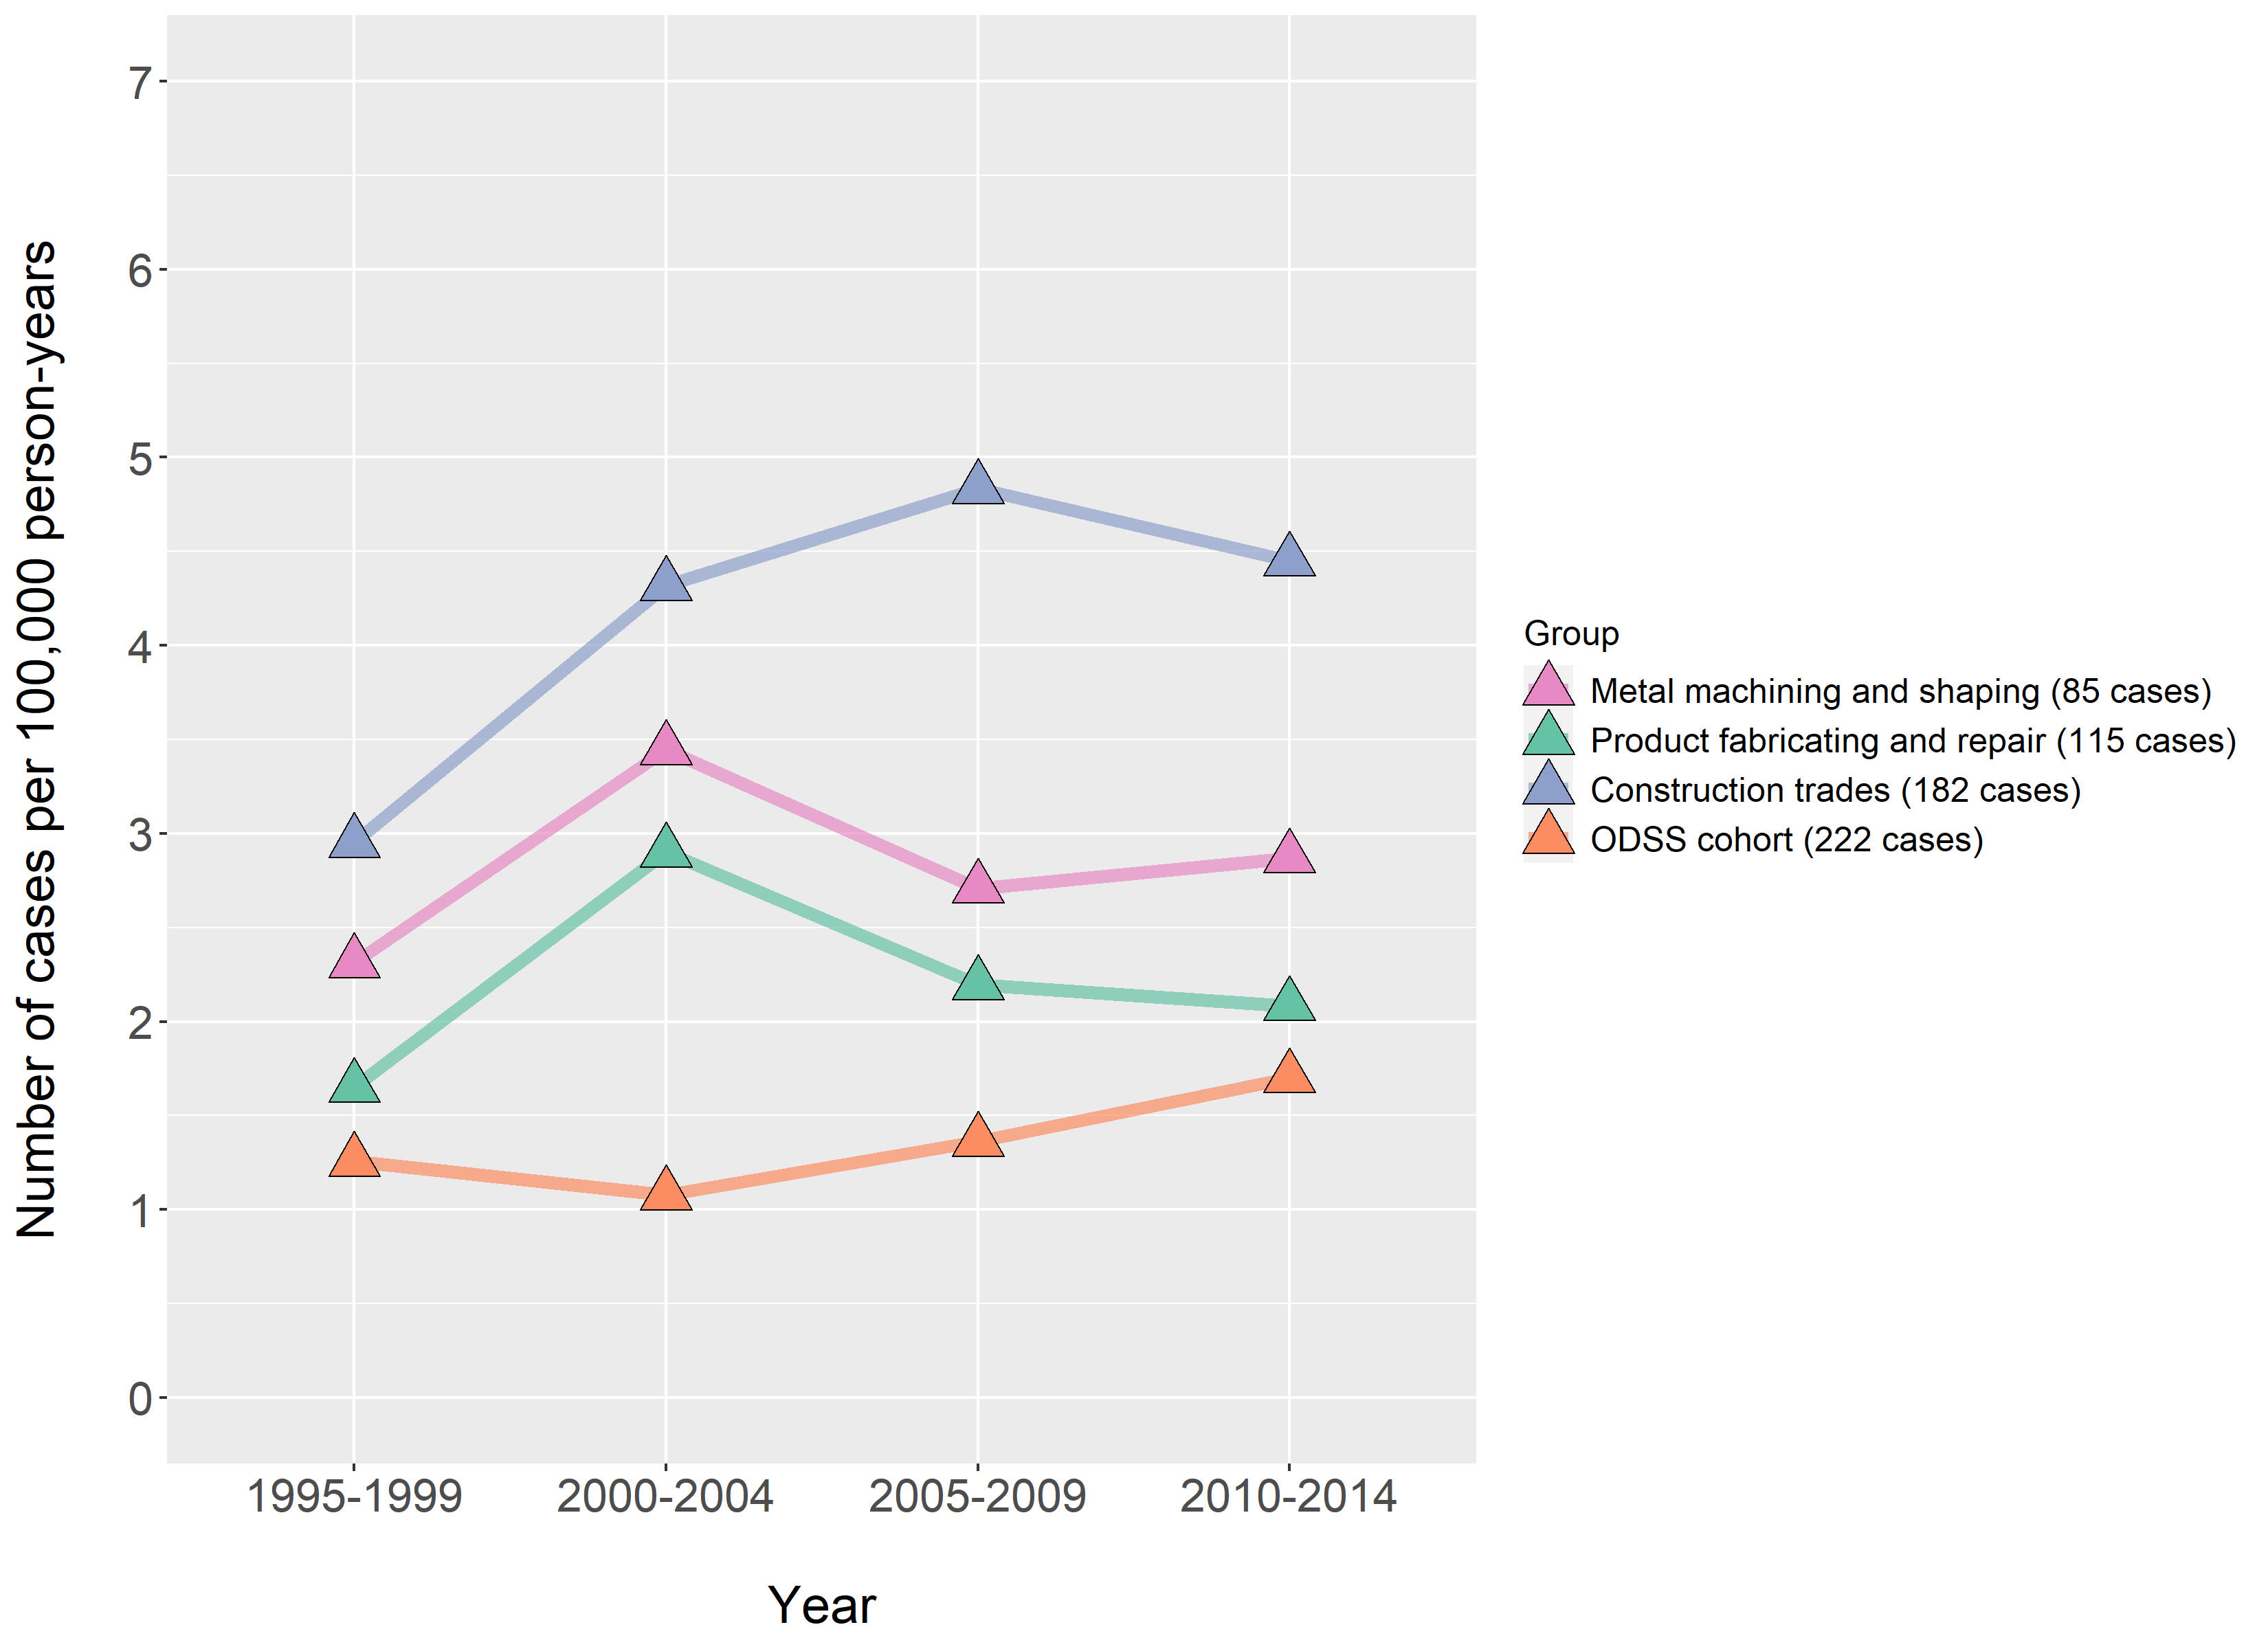
The crude incidence rate is the number of cases of disease diagnosed per person per year of follow-up in the ODSS cohort. The age-standardized incidence rate is the rate we would observe if we removed the influence of aging in the cohort over time. The general population of males in Ontario in 1995 was used as the standard. All rates are expressed per 100,000 persons per year.
Please note that ODSS results shown here may differ from those previously published or presented. This may occur due to changes in case definitions, methodological approaches, and the ongoing nature of the surveillance cohort.
References
- International Agency for Research on Cancer (IARC). List of Classifications by cancer sites with sufficient or limited evidence in humans, IARC Monographs Volumes 1-127 (2020).
- Bianchi C, Bianchi T. Malignant Mesothelioma: Global Incidence and Relationship with Asbestos. Ind Health. 2007;45(3):379–87.
- Government of Canada. Prohibition of Asbestos and Products Containing Asbestos Regulations: SOR/2018-196. Canada Gazette, Part II, Vol 152, Number 21 (2018).
- Government of Canada. Asbestos (Updated 2020).
- HealthLinkBC. Asbestos: When Should I Worry? (Updated 2017).
- Ruff K. How Canada changed from exporting asbestos to banning asbestos: The challenges that had to be overcome. Int J Environ Res Public Health. 2017;14(10).
- Kuyek J, MiningWatch Canada. Asbestos Mining in Canada (2003).
- Williams PRD, Phelka AD, Paustenbach DJ. A review of historical exposures to asbestos among skilled craftsmen (1940-2006). J Toxicol Environ Heal – Part B Crit Rev. 2007;10(5):319–77.
- Rosner D, Markowitz G. Ain’t necessarily so!”: The brake industry’s impact on asbestos regulation in the 1970s. Am J Public Health. 2017;107(9):1395–9.