Lung Cancer
Background
In Canada, lung cancer is the leading cause of cancer mortality in men and women [1]. Lung cancer is primarily caused by smoking, and prevention efforts have largely focused on tobacco control. However, the Burden of Occupational Cancer Project found that approximately 15% of lung cancers are caused by workplace exposures [2]. Workers in many occupations are exposed to known lung carcinogens. Asbestos, crystalline silica, diesel engine exhaust, and welding fumes are the four most important lung occupational carcinogens in Canada [2].
Known occupational risk factors
-
- Dusts and fibres (e.g. asbestos, crystalline silica) [3]
- Combustion products (e.g. diesel engine exhaust, secondhand smoke, soot) [3-5]
- Metals and their compounds (e.g. arsenic, beryllium, cadmium, chromium VI, nickel, welding fumes) [3,6]
- Ionizing radiation (e.g. radon, x-radiation, gamma-radiation) [7]
- Occupational exposures in painting, iron and steel founding, coke production, rubber manufacturing, and aluminum production [8]
Possible occupational risk factors
-
- Acid mist [8]
- Benzene [9]
- Bitumen [10]
- Polycyclic aromatic hydrocarbons (PAHs) [11]
Key Findings
The greatest risks of lung cancer are observed among workers employed in mining, construction, and transportation occupations. Occupational variation in smoking may also explain some differences in observed lung cancer risk.
Mining 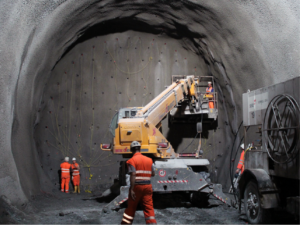
Workers in mining and quarrying are exposed to a number of lung carcinogens including crystalline silica, radon, asbestos, and diesel engine exhaust. Workers in most mine types and jobs appeared to have increased risk of lung cancer.
-
- Mines, quarries and oil wells: 1.36 times the risk
- Quarries and sand pits: 1.77 times the risk
- Metal mines: 1.34 times the risk
- Uranium mines: 1.88 times the risk
- Gold quartz mines: 1.45 times the risk
- Non-metal mines: 1.09 times the risk
- Asbestos mines: 3.96 times the risk
- Mining and quarrying occupations: 1.39 times the risk
- Rock and soil-drilling: 1.62 times the risk
- Cutting, handling and loading occupations: 1.50 times the risk
- Mines, quarries and oil wells: 1.36 times the risk
Construction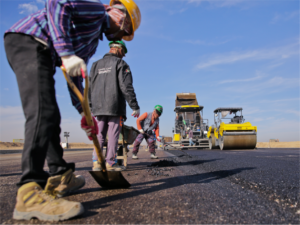
Construction workers are involved in a wide variety of jobs and work settings with potential exposure to a wide range of lung carcinogens including diesel engine exhaust, crystalline silica dust, and asbestos-containing materials including insulation. In addition, painters, who may be exposed to chemicals in paints, solvents and adhesives are at increased risk [8].
-
- Construction trades occupations: 1.10 times the risk
- Excavating, grading, paving & related: 1.38 times the risk
- Construction trades occupations: 1.10 times the risk
-
-
- Other construction trades: 1.11 times the risk
- Painters and paperhangers: 1.35 times the risk
- Insulators: 2.01 times the risk
- Structural metal erectors: 1.35 times the risk
- Glaziers: 1.30 times the risk
- Roofing, waterproofing and related occupations: 1.43 times the risk
- Plasterers and related occupations: 1.23 times the risk
- Other construction trades: 1.11 times the risk
-
Primary metal industries and metal manufacturing
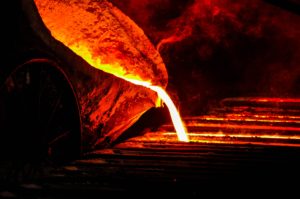 Workers in these industries are exposed to aluminum, arsenic, beryllium, cadmium, chromium, nickel compounds, silica dust, and PAHs. IARC has also classified iron and steel founding as having an increased risk of lung cancer. Boilermakers may be exposed to asbestos and moulding, coremaking and metal casting may involve exposure to crystalline silica.
-
- Primary Metal Industries: 1.17 times the risk
- Iron foundries: 1.49 times the risk
- Aluminum rolling, casting and extruding: 1.40 times the risk
- Smelting and refining: 1.25 times the risk
- Primary Metal Industries: 1.17 times the risk
-
- Metal processing occupations: 1.26 times the risk
- Metal heat treating occupations: 1.59 times the risk
- Metal processing and related occupations (foremen): 1.58 times the risk
- Moulding, coremaking and metal casting occupations: 1.40 times the risk
- Metal processing occupations: 1.26 times the risk
-
- Metal shaping occupations: 1.19 times the risk
- Forging occupations: 1.40 times the risk
- Boilermakers, platers and structural metal workers: 1.39 times the risk
- Metalworking-machine operators: 1.21 times the risk
- Metal shaping occupations: 1.19 times the risk
Transportation sector
Workers employed in the transportation sector may be exposed to elevated levels of diesel engine exhaust through work in or around diesel-powered equipment.
-
- Transportation industry: 1.23 times the risk
- Taxicab operations: 1.53 times the risk
- Truck transport: 1.49 times the risk
- Transportation industry: 1.23 times the risk
Logging and wood processing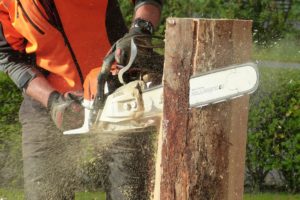
Workers in these occupations may be exposed to exhaust from diesel-powered equipment, as well as wood dusts, arsenic-containing insecticides, and other wood preservatives.
-
- Logging industry: 1.25 times the risk
- Log hoisting, sorting, moving and related occupations: 1.46 times the risk
- Timber cutting and related occupations: 1.23 times the risk
- Wood manufacturing industries: 1.10 times the risk
- Sawmills, planning mills and shingle mills: 1.31 times the risk
- Labouring and other elemental work in wood processing: 1.44 times the risk
- Logging industry: 1.25 times the risk
Bartending and food service
Workers in these occupations were exposed to high levels of second-hand tobacco smoke in the workplace until smoking was banned in bars and restaurants in Ontario in 2006 and patios in 2015 [2,12]. Differences in occupational rates of smoking may also contribute to the excess risks observed for these groups.
-
- Bartenders: 1.71 times the risk
- Waiters, hostesses and stewards, food and beverage: 1.10 times the risk
Sex Differences in Lung Cancer Risk
Historically, lung cancer rates have been higher in men than women. However, this gap has decreased over time as smoking rates have declined faster among men than women, contributing to a faster decline in lung cancer incidence rates among men than women [13-15]. Although occupational exposure is a significant contributor to lung cancer burden, little research has focused on gender or sex differences in occupational lung cancer [16,17]. Here we highlight elevated risks of lung cancer among female workers in select occupations.
Machining and related occupations
Female workers in machining and related occupations showed a greater increase in lung cancer risk than male workers. While those employed in this area may include workers who shape various types of materials, those performing metal machining or related metal work may be exposed to dusts and fumes containing metals and their compounds [17,18]. Some examples of carcinogenic exposures among these workers include welding fumes, nickel compounds, cadmium, and chromium VI [3,6,8].
| Occupational Group | Females | Males |
| Machining and related | 1.44 x the risk | 1.10 x the risk |
|
Metal machining |
1.55 x the risk | 0.98 x the risk |
|
Metal shaping and forming, except machining |
1.46 x the risk | 1.16 x the risk |
Construction
Although both male and female workers in construction trades occupations overall are at an increased risk of lung cancer compared to workers in other occupations, this is more pronounced among female workers in certain construction trades. Construction workers have the potential to be exposed to a variety of lung carcinogens such as silica, asbestos, and diesel engine exhaust [3,5].
| Occupational Group | Females | Males |
|
Excavating, grading, paving and related |
2.25 x the risk | 1.36 x the risk |
|
Other construction trades |
1.54 x the risk | 1.11 x the risk |
|
Carpenters and related |
2.21 x the risk | 0.93 x the risk |
|
Glaziers |
4.75 x the risk | 1.24 x the risk |
|
Labouring and other elemental work in construction |
1.69 x the risk | 1.11 x the risk |
Mining
Although an increased risk of lung cancer is well documented among mining workers, previous studies have often included only limited information on female mining workers [16]. Based on ODSS results, female workers in mining occupations face a disproportionately elevated risk of lung cancer. Workers in mining occupations are exposed to numerous lung carcinogens including crystalline silica, radon, asbestos, and diesel engine exhaust [3,5].
| Occupational Group | Females | Males |
|
Mining and quarrying |
3.05 x the risk | 1.36 x the risk |
Motor transport operating occupations
Female workers were at an increased risk for lung cancer in transportation-related occupations, where exposure to diesel engine exhaust is common [5].
| Occupational Group | Females | Males |
|
Motor transport operating |
1.70 x the risk | 1.42 x the risk |
|
Bus drivers |
1.48 x the risk | 1.08 x the risk |
|
Taxi drivers and chauffeurs |
2.75 x the risk | 1.00 x the risk |
|
Truck drivers |
1.85 x the risk | 1.46 x the risk |
Service occupations
Lung cancer risks were elevated in female service workers but reduced in male workers across many service jobs. Other studies have found mixed results for risk of lung cancer in these workers due to the diversity of tasks in the service industry [19]. Some service workers in restaurant settings may have been exposed to second-hand smoke, especially prior to bans on smoking in restaurants and patios [20]. Some research indicates that polycyclic aromatic hydrocarbons (PAHs, found in cooking fumes) may increase lung cancer risk [8,11]. There may also be other exposures unaccounted for in these workers.
| Occupational Group | Females | Males |
|
Food and beverage preparation and related service occupations |
1.19 x the risk | 0.79 x the risk |
|
Chefs and cooks |
1.30 x the risk | 0.79 x the risk |
|
Bartenders |
2.27 x the risk | 1.21 x the risk |
|
Waiters, hostesses and stewards, food and beverage |
1.18 x the risk | 0.75 x the risk |
Potential contributors to sex differences in lung cancer risk
There are several of factors that could cause female workers to experience different hazards or different levels of exposure than male workers. For example, gender roles may influence the specific tasks male and female workers perform within a given occupation, leading to differences in exposure [21-23]. Personal protective equipment is often not designed with female-specific fit in mind, and may not have the same effectiveness on female bodies as male bodies [16,24]. Female workers may also find it more physically demanding to use protective equipment [16]. Part-time workers, who are more likely to be women, may receive less training on how to properly use protective equipment [16]. Further research is also needed to understand how sex-related factors such as height, reach and strength might impact exposure and the effectiveness of control strategies other than personal protective equipment [16,22].
Biological factors, such as hormonal and metabolic differences between male and female workers, may impact the effect of occupational exposures. Based on some studies of sex differences in smoking-related lung cancer risk, it is possible that female workers may be more susceptible to the carcinogenic effects of some occupational exposures than male workers [25,26].
Cancer risk may also be affected by behavioural differences. Smoking is more common among workers in manual and industrial occupations compared to other workers and this difference may be greater among females than males [27,28]. It is possible that other behavioural differences such as physical activity and dietary patterns may also contribute to observed sex differences in lung cancer risk.
Relative Risk by Industry and Occupation
Figure 1. Risk of lung cancer diagnosis among workers employed in each industry group relative to all others, Occupational Disease Surveillance System (ODSS), 1983-2020
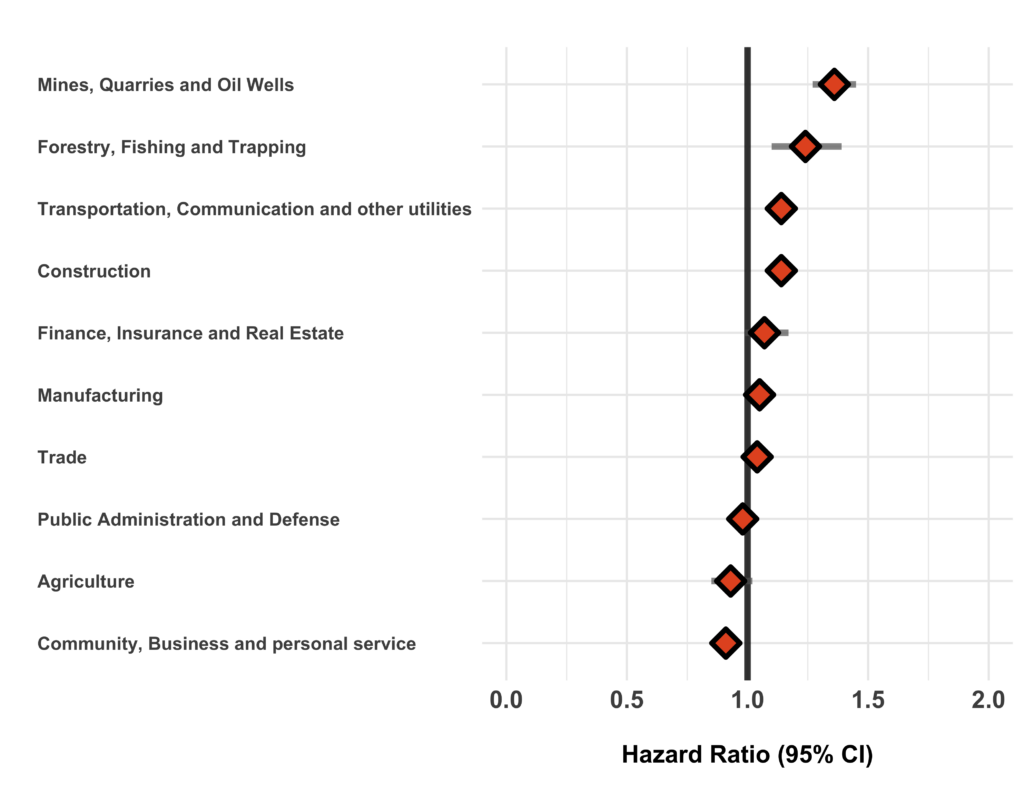
The hazard ratio is an estimate of the average time to diagnosis among workers in each industry/occupation group divided by that in all others during the study period. Hazard ratios above 1.00 indicate a greater risk of disease in a given group compared to all others. Estimates are adjusted for birth year and sex. The width of the 95% Confidence Interval (CI) is based on the number of cases in each group (more cases narrows the interval).
Figure 2. Risk of lung cancer diagnosis among workers employed in each occupation group relative to all others, Occupational Disease Surveillance System (ODSS), 1983-2020
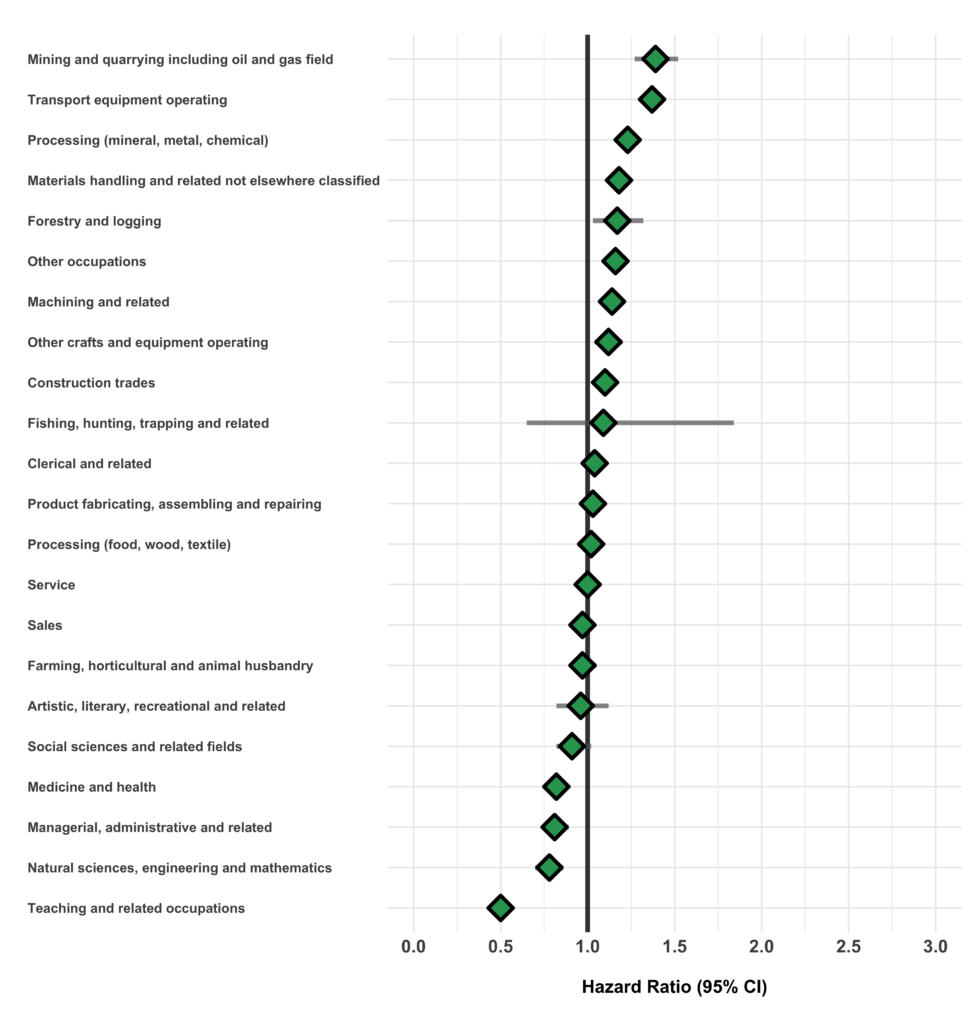
The hazard ratio is an estimate of the average time to diagnosis among workers in each industry/occupation group divided by that in all others during the study period. Hazard ratios above 1.00 indicate a greater risk of disease in a given group compared to all others. Estimates are adjusted for birth year and sex. The width of the 95% Confidence Interval (CI) is based on the number of cases in each group (more cases narrows the interval).
Table of Results
Table 1. Surveillance of Lung Cancer: Number of cases, workers employed, and hazard ratios in each industry (SIC)
| SIC Code * | Industry Group | Number of cases | Number of workers employed | Hazard Ratio (95% CI) † |
| 1 | Agriculture | 370 | 35,010 | 0.91 (0.82-1.01) |
| 2/3 | Forestry, Fishing and Trapping |
249 | 10,696 | 1.25 (1.10-1.42) |
| 4 | Mines, Quarries and Oil Wells |
780 | 23,173 | 1.40 (1.31-1.51) |
| 5 | Manufacturing | 12,453 | 693,490 | 1.04 (1.02-1.07) |
| 6 | Construction | 3,568 | 210,957 | 1.13 (1.09-1.17) |
| 7 | Transportation, Communication and Other Utilities |
3,483 | 197,194 | 1.13 (1.09-1.17) |
| 8 | Trade | 5,306 | 429,234 | 1.03 (1.00-1.06) |
| 9 | Finance, Insurance and Real Estate |
466 | 23,989 | 1.05 (0.96-1.15) |
| 10 | Community, Business and Personal Service |
7,160 | 599,548 | 0.91 (0.89-0.94) |
| 11 | Public Administration and Defense |
3,259 | 190,864 | 0.99 (0.95-1.03) |
| * SIC: Standard Industrial Classification (1970) | ||||
| † Hazard rate in each group relative to all others | ||||
Table 2. Surveillance of Lung Cancer: Number of cases, workers employed, and hazard ratios in each occupation (CCDO) group
| CCDO Code * | Occupation Group | Number of cases | Number of workers employed | Hazard Ratio (95% CI) † |
| 11 | Managerial, administrative and related |
344 | 30,994 | 0.81 (0.73-0.90) |
| 21 | Natural sciences, engineering and mathematics |
278 | 26,342 | 0.75 (0.67-0.84) |
| 23 | Social sciences and related fields |
250 | 30,713 | 0.95 (0.84-1.08) |
| 25 | Religion | 0 | 128 | – |
| 27 | Teaching and related | 328 | 48,476 | 0.51 (0.46-0.57) |
| 31 | Medicine and health | 1,441 | 135,341 | 0.83 (0.79-0.88) |
| 33 | Artistic, literary, recreational and related |
130 | 14,992 | 0.98 (0.83-1.17) |
| 41 | Clerical and related | 2,777 | 197,315 | 1.04 (1.00-1.09) |
| 51 | Sales | 1,499 | 148,113 | 0.97 (0.93-1.03) |
| 61 | Service | 5,289 | 370,848 | 0.99 (0.96-1.02) |
| 71 | Farming, horticultural and animal husbandry |
546 | 50,146 | 0.95 (0.87-1.03) |
| 73 | Fishing, hunting, trapping and related |
11 | 558 | 1.03 (0.57-1.86) |
| 75 | Forestry and logging | 215 | 10,680 | 1.15 (1.01-1.32) |
| 77 | Mining and quarrying, including oil and gas field |
432 | 13,028 | 1.43 (1.30-1.58) |
| 81 | Processing (mineral, metal, chemical) |
1,406 | 79,219 | 1.22 (1.15-1.28) |
| 82 | Processing (food, wood, textile) |
1,404 | 99,236 | 0.99 (0.94-1.04) |
| 83 | Machining and related | 3,569 | 189,401 | 1.12 (1.09-1.16) |
| 85 | Product fabricating, assembling and repairing |
5,714 | 328,270 | 1.02 (0.99-1.05) |
| 87 | Construction trades | 3,980 | 215,564 | 1.08 (1.05-1.12) |
| 91 | Transport equipment operating |
3,632 | 168,082 | 1.38 (1.33-1.42) |
| 93 | Materials handling and related, not elsewhere classified |
2,488 | 153,025 | 1.16 (1.11-1.21) |
| 95 | Other crafts and equipment operating |
556 | 28,299 | 1.10 (1.01-1.19) |
| 99 | Other occupations not elsewhere classified | 3,364 | 215,227 | 1.12 (1.08-1.16) |
| * CCDO: Canadian Classification Dictionary of Occupations (1971) | ||||
| † Hazard rate in each group relative to all others | ||||
Please note that ODSS results shown here may differ from those previously published or presented. This may occur due to changes in case definitions, methodological approaches, and the ongoing nature of the surveillance cohort.
References
- Canadian Cancer Society. Canadian Cancer Statistics 2019.. Toronto, Ontario; 2019.
- Occupational Cancer Research Centre. Burden of Occupational Cancer in Canada: Major workplace carcinogens and prevention of exposure. Toronto, Ontario; 2019.
- International Agency for Research on Cancer. Arsenic, Metals, Fibres and Dusts. IARC Monogr Eval Carcinog Risks to Humans. Vol. 100C (2012).
- International Agency for Research on Cancer. Personal habits and indoor combustions. IARC Monogr Eval Carcinog Risks to Humans. Vol. 100E (2012).
- International Agency for Research on Cancer. Diesel and Gasoline Engine Exhausts and Some Nitroarenes . IARC Monogr Eval Carcinog Risks to Humans. Vol. 105 (2014).
- International Agency for Research on Cancer. Welding, molybdenum trioxide, and indium tin oxide. IARC Monogr Eval Carcinog Risks to Humans. Vol. 118 (2018).
- International Agency for Research on Cancer. Radiation. IARC Monogr Eval Carcinog Risks to Humans. Vol. 100D (2012).
- International Agency for Research on Cancer. Chemical agents and related occupations. IARC Monogr Eval Carcinog Risks to Humans. Vol. 100F (2012).
- International Agency for Research on Cancer. Benzene. IARC Monogr Eval Carcinog Risks to Humans. Vol. 120 (2018).
- International Agency for Research on Cancer. Bitumens and Bitumen emissions, and some N-and S-Heterocyclic Polycyclic aromatic Hydrocarbons. IARC Monogr Eval Carcinog Risks to Humans. Vol. 103 (2011).
- International Agency for Research on Cancer. Some non-heterocyclic polycyclic aromatic hydrocarbons and some related exposures. IARC Monogr Eval Carcinog Risks to Humans. Vol. 92 (2010).
- Ferguson R. Ontario to ban smoking on restaurant patios, sports fields | The Star. The Star. 2014 Nov 7 [cited 2020 Aug 20].
- Ragavan M, Patel MI. The evolving landscape of sex-based differences in lung cancer: a distinct disease in women. European Respiratory Review; 31. Epub ahead of print 31 March 2022.
- Navaneelan T, Janz T. Cancer in Canada: Focus on Lung, Colorectal, Breast and Prostate. 82-624–X, Statistics Canada, December 2011.
- Government of Canada. Lung cancer is the leading cause of cancer death in Canada. Statistics Canada 2022. (accessed November 15, 2022).
- Camp PG, Dimich-Ward H, Kennedy SM. Women and occupational lung disease: sex differences and gender influences on research and disease outcomes. Clin Chest Med 2004; 25: 269–279.
- Labrèche F, Kim J, Song C, Pahwa M, Ge CB, Arrandale VH, et al. The current burden of cancer attributable to occupational exposures in Canada. Preventive Medicine 2019;122:128–39.
- Peters CE, Ge CB, Hall AL, Davies HW, Demers PA. CAREX Canada: an enhanced model for assessing occupational carcinogen exposure. Occup Environ Med 2015;72:64–71.
- Jung JKH, Feinstein SG, Palma Lazgare L, Macleod JS, Arrandale VH, McLeod CB, et al. Examining lung cancer risks across different industries and occupations in Ontario, Canada: the establishment of the Occupational Disease Surveillance System. Occup Environ Med 2018;75:545–52.
- Rydz E, Arrandale VH, Peters CE. Population-level estimates of workplace exposure to secondhand smoke in Canada. Can J Public Health 2019; 111: 125–133.
- Messing K, Doniol-Shaw G, Haëntjens C. Sugar and Spice and Everything Nice: Health Effects of the Sexual Division of Labor among Train Cleaners. Int J Health Serv 1993;23:133–46.
- Biswas A, Harbin S, Irvin E, Johnston H, Begum M, Tiong M, et al. Sex and Gender Differences in Occupational Hazard Exposures: A Scoping Review of the Recent Literature. Curr Envir Health Rpt 2021;8:267-80.
- Messing K, Dumais L, Courville J, et al. Evaluation of exposure data from men and women with the same job title. J Occup Med 1994; 36: 913–917.
- Han DH. Fit factors for quarter masks and facial size categories. Ann Occup Hyg 2000; 44: 227-234.
- Zang EA, Wynder EL. Differences in lung cancer risk between men and women: examination of the evidence. J Natl Cancer Inst 1996;88:183–92.
- Stapelfeld C, Dammann C, Maser E. Sex‐specificity in lung cancer risk. Int J Cancer 2020;146:2376–82.
- Chaiton M, Callard C. Mind the Gap: Disparities in Cigarette Smoking in Canada. Tob Use Insights 2019;12:1179173X1983905.
- Gaudette L, Richardson A, Huang S. Which Workers Smoke – Health Reports. Catalogue 82-003, Statistics Canada, (1998).