Sinonasal Cancer
Background
Sinonasal cancer is a cancer of the nasal cavities and surrounding sinus tissue. Sinonasal cancer is rare, with an annual incidence rate of about 1 case per 100,000 people in most developed countries [1]. Inhalation of certain dusts and metal compounds are known causes of sinonasal cancer.
Occupational risk factors
-
- Wood dust [2]
- Leather dust [2]
- Nickel compounds [2]
Possible occupational risk factors
-
- Chromium VI compounds [2]
- Formaldehyde [3]
- Textile manufacturing [2]
- Mineral oil [4]
Key Findings
Elevated risk of sinonasal cancer was observed among workers with potential exposure to wood dust, nickel compounds, chromium (VI) compounds, and formaldehyde. Given the rarity of this type of cancer, many groups had a relatively small number of cases and results should be interpreted with caution.
Wood processing and fabrication
Elevated risks were found among several groups with exposure to wood dust. In addition to wood dust, workers in these occupations may have exposure to other carcinogens including formaldehyde from resins used in wood products such as fibreboard, or during pulp and paper processing [3].
-
- Pulp and papermaking and related occupations: 4.01 times the risk
- Wood products fabricating, assembling and repairing occupations: 1.32 times the risk
- Carpenters and related occupations: 1.30 times the risk
Metal working occupations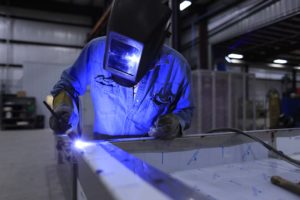
Workers in metal working occupations may have exposure to nickel and chromium VI compounds, which have been linked to risk of sinonasal cancer. Varying levels of chromium VI and nickel compounds are added to metal alloys such as stainless steel to prevent corrosion and improve strength [5]. Workers may be exposed to these metal fumes and dusts during tasks such as welding and grinding
-
- Sheet metal workers: 1.59 times the risk
- Welding and flame cutting occupations: 1.22 times the risk
- Metalworking-machine operators, not elsewhere classified: 1.12 times the risk
Construction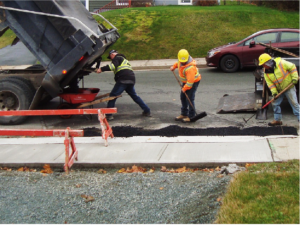
Some workers in construction may be exposed to wood dust, chromium VI compounds, nickel compounds, and formaldehyde, but the causes for excesses in these groups are not clear [6,7].
-
- Highway, bridge and street construction industry: 2.39 times the risk
- Building construction industry: 1.43 times the risk
- Excavating, grading, paving and related occupations: 2.32 times the risk
Product fabricating, assembling and repairing
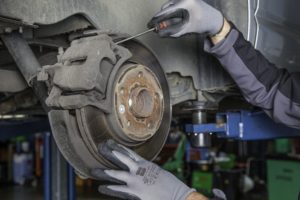
Workers in these jobs have a range of exposures such as chromium VI compounds, nickel compounds, and mineral oil.
-
- Product fabricating, assembling and repairing occupations: 1.33 times the risk
- Fabricating assembling installing and repairing occupations, electrical and electronic and related equipment: 1.65 times the risk
- Fabricating and assembling occupations, metal products, not elsewhere classified: 1.35 times the risk
- Fabricating, assembling and repairing occupations, wood products: 1.32 times the risk
- Product fabricating, assembling and repairing occupations: 1.33 times the risk
-
- Motor vehicle mechanics and repairmen: 1.49 times the risk
- Motor vehicle fabricating and assembling occupations, not elsewhere classified: 1.39 times the risk
- Industrial, farm, and construction machinery mechanics and repairmen: 1.22 times the risk
Mining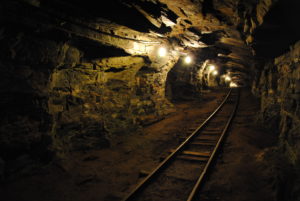
An excess risk of sinonasal cancer was observed among workers employed in miscellaneous metal mines. Among the metal mines included in this category is nickel, with Ontario being the largest producer in Canada [8].
-
- Metal mines: 1.66 times the risk
- Miscellaneous metal mines (primarily nickel): 2.45 times the risk
- Metal mines: 1.66 times the risk
Other groups
Several additional groups were observed with increased risk of sinonasal cancer, but case counts were too small in most subgroups to further examine these associations. A potential risk factor for these groups may be exposure to formaldehyde. Formaldehyde is a known human carcinogen, although the evidence suggesting its carcinogenicity for sinonasal cancer is more limited [1].
Janitors and cleaners may be exposed to formaldehyde in cleaning agents. Permanent press fabrics may contain formaldehyde, which could increase risk among workers in the textile industry. Leather dust has also been linked to sinonasal cancer risk, but too few cases were observed for leather industry workers to examine this association.
-
- Janitors and cleaners: 1.18 times the risk
- Textile industries: 1.87 times the risk
Relative Risk by Industry and Occupation
Figure 1. Risk of sinonasal cancer diagnosis among workers employed in each industry group relative to all others, Occupational Disease Surveillance System (ODSS), 1999-2016
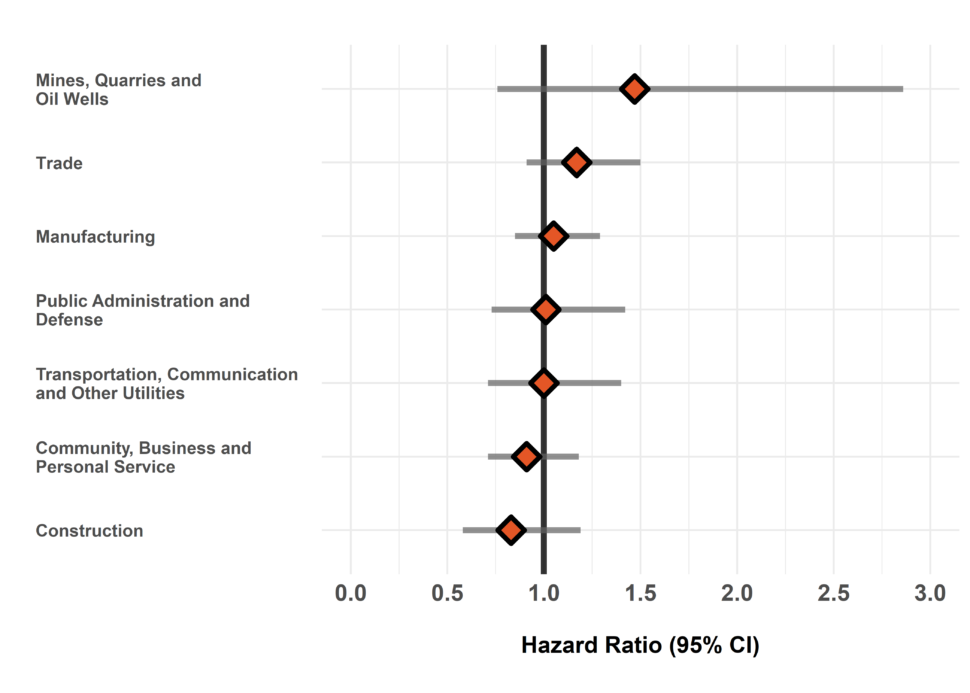
The hazard ratio is an estimate of the average time to diagnosis among workers in each industry/occupation group divided by that in all others during the study period. Hazard ratios above 1.00 indicate a greater risk of disease in a given group compared to all others. Estimates are adjusted for birth year and sex. The width of the 95% Confidence Interval (CI) is based on the number of cases in each group (more cases narrows the interval).
Figure 2. Risk of sinonasal cancer diagnosis among workers employed in each occupation group relative to all others, Occupational Disease Surveillance System (ODSS), 1999-2016
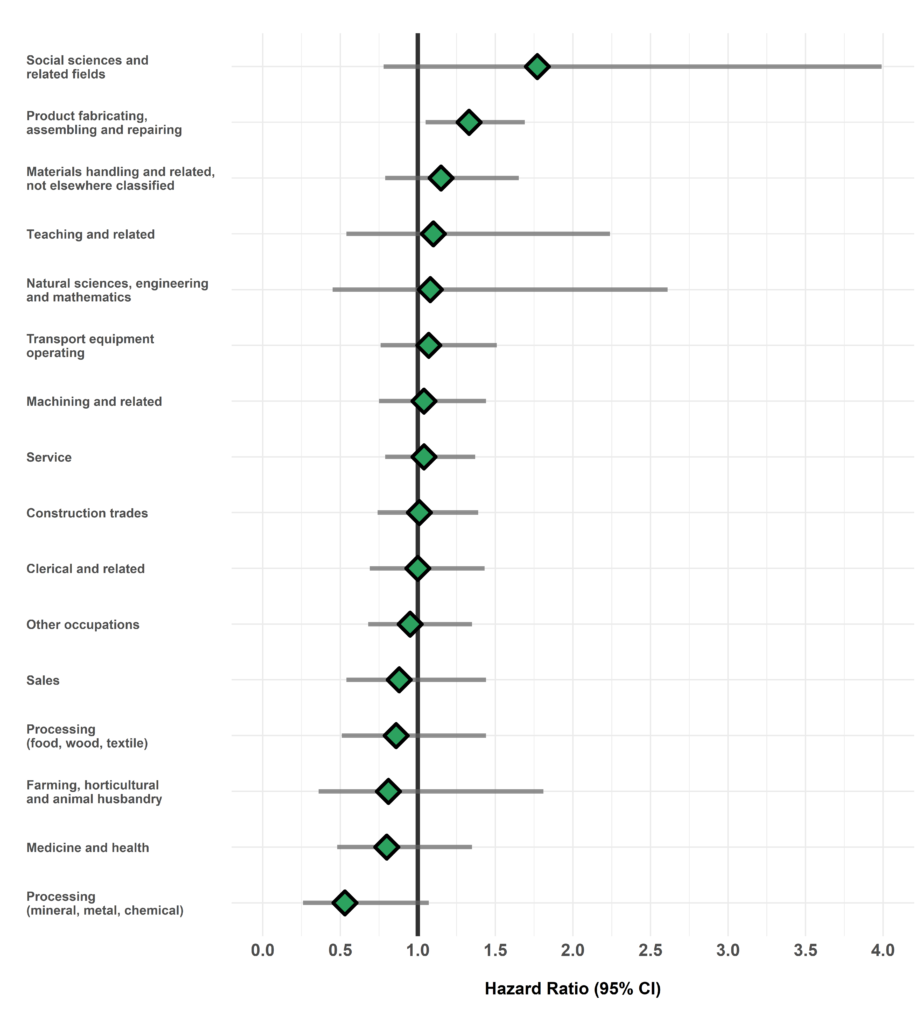
The hazard ratio is an estimate of the average time to diagnosis among workers in each industry/occupation group divided by that in all others during the study period. Hazard ratios above 1.00 indicate a greater risk of disease in a given group compared to all others. Estimates are adjusted for birth year and sex. The width of the 95% Confidence Interval (CI) is based on the number of cases in each group (more cases narrows the interval).
Table of Results
Table 1. Surveillance of Sinonasal Cancer: Number of cases, workers employed, and hazard ratios in each industry (SIC)
| SIC Code * | Industry Group | Number of cases | Number of workers employed | Hazard Ratio (95% CI) † |
| 1 | Agriculture | <5 | 35,016 | – |
| 2/3 | Forestry, Fishing and Trapping |
<5 | 10,700 | – |
| 4 | Mines, Quarries and Oil Wells |
9 | 23,207 | 1.47 (0.76-2.86) |
| 5 | Manufacturing | 149 | 693,662 | 1.05 (0.85-1.29) |
| 6 | Construction | 34 | 211,005 | 0.83 (0.58-1.19) |
| 7 | Transportation, Communication and Other Utilities |
38 | 197,240 | 1.00 (0.71-1.40) |
| 8 | Trade | 75 | 429,312 | 1.17 (0.91-1.50) |
| 9 | Finance, Insurance and Real Estate |
<5 | 23,993 | – |
| 10 | Community, Business and Personal Service |
84 | 599,694 | 0.91 (0.71-1.18) |
| 11 | Public Administration and Defense |
38 | 190,913 | 1.01 (0.73-1.42) |
| * SIC: Standard Industrial Classification (1970) | ||||
| † Hazard rate in each group relative to all others | ||||
Table 2. Surveillance of Sinonasal Cancer: Number of cases, workers employed, and hazard ratios in each occupation (CCDO) group
| CCDO Code * | Occupation Group | Number of cases | Number of workers employed | Hazard Ratio (95% CI) † |
| 11 | Managerial, administrative and related |
<5 | 31,005 | – |
| 21 | Natural sciences, engineering and mathematics |
5 | 26,348 | 1.08 (0.45-2.61) |
| 23 | Social sciences and related fields |
6 | 30,718 | 1.77 (0.78-3.99) |
| 25 | Religion | 0 | 128 | – |
| 27 | Teaching and related | 8 | 48,491 | 1.10 (0.54-2.24) |
| 31 | Medicine and health | 16 | 135,374 | 0.80 (0.48-1.35) |
| 33 | Artistic, literary, recreational and related |
<5 | 14,998 | – |
| 41 | Clerical and related | 32 | 197,367 | 1.00 (0.69-1.43) |
| 51 | Sales | 17 | 148,145 | 0.88 (0.54-1.44) |
| 61 | Service | 63 | 370,946 | 1.04 (0.79-1.37) |
| 71 | Farming, horticultural and animal husbandry |
6 | 50,153 | 0.81 (0.36-1.81) |
| 73 | Fishing, hunting, trapping and related |
<5 | 558 | – |
| 75 | Forestry and logging | <5 | 10,684 | – |
| 77 | Mining and quarrying, including oil and gas field |
<5 | 13,044 | – |
| 81 | Processing (mineral, metal, chemical) |
8 | 79,245 | 0.53 (0.26-1.07) |
| 82 | Processing (food, wood, textile) |
15 | 99,255 | 0.86 (0.51-1.44) |
| 83 | Machining and related | 41 | 189,448 | 1.04 (0.75-1.44) |
| 85 | Product fabricating, assembling and repairing |
85 | 328,353 | 1.33 (1.05-1.69) |
| 87 | Construction trades | 45 | 215,621 | 1.01 (0.74-1.39) |
| 91 | Transport equipment operating |
36 | 168,139 | 1.07 (0.76-1.51) |
| 93 | Materials handling and related, not elsewhere classified |
31 | 153,066 | 1.15 (0.79-1.65) |
| 95 | Other crafts and equipment operating |
<5 | 28,309 | – |
| 99 | Other occupations not elsewhere classified | 36 | 215,277 | 0.95 (0.68-1.35) |
| * CCDO: Canadian Classification Dictionary of Occupations (1971) | ||||
| † Hazard rate in each group relative to all others | ||||
Please note that ODSS results shown here may differ from those previously published or presented. This may occur due to changes in case definitions, methodological approaches, and the ongoing nature of the surveillance cohort.
References
- Binazzi A, Ferrante P, Marinaccio A. Occupational exposure and sinonasal cancer: A systematic review and meta-analysis. BMC Cancer. 2015;15(1).
- IARC Working Group. List of Classifications by cancer sites with sufficient or limited evidence in humans, Volumes 1 to 113. Lyon, France: International Agency for Research on Cancer (IARC).
- IARC Working Group. A Review of Human Carcinogens- Chemical agents and related occupations. Vol. 100F. Lyon, France: International Agency for Research on Cancer (IARC); 2012.
- Samant S, Kruger E. Cancer of the paranasal sinuses. Curr Oncol Rep. 2007;9(2):147–51.
- IARC Working Group. A Review of Human Carcinogens- Welding, molybdenum trioxide, and indium tin oxide. Vol. 118. Lyon, France: International Agency for Research on Cancer (IARC); 2018.
- Wong CC, Gamboni SE, Palmer AM, Nixon RL. Occupational allergic contact dermatitis to chromium from cement: Estimating the size of the problem in Australia. Australas J Dermatol. 2015;56(4):290–3.
- Thyssen JP, Jensen P, Lidén C, Julander A, Jellesen MS, Menné T, et al. Assessment of nickel and cobalt release from 200 unused hand-held work tools for sale in Denmark – Sources of occupational metal contact dermatitis? Sci Total Environ. 2011;409(22):4663–6.
- Ontario Mining Association. Ontario Mining – Facts & Figures. [cited 2020 Aug 21].